


Journal of Agricultural Science and Technology ›› 2025, Vol. 27 ›› Issue (11): 72-82.DOI: 10.13304/j.nykjdb.2025.0603
• AGRICULTURAL INNOVATION FORUM • Previous Articles Next Articles
Fenghua ZHANG1( ), Zetian YU1, Xiaoxia DONG1(), Hua PENG1, Huihui WANG2
Received:2025-08-19
Accepted:2025-09-11
Online:2025-11-15
Published:2025-11-17
Contact:
Xiaoxia DONG
张凤华1(), 余泽田1, 董晓霞1(), 彭华1, 王惠惠2
通讯作者:
董晓霞
作者简介:张凤华 E-mail:qgqx4q@163.com;
基金资助:CLC Number:
Fenghua ZHANG, Zetian YU, Xiaoxia DONG, Hua PENG, Huihui WANG. Regional Differences and Convergence of Green Total Factor Productivity in China’s Animal Husbandry[J]. Journal of Agricultural Science and Technology, 2025, 27(11): 72-82.
张凤华, 余泽田, 董晓霞, 彭华, 王惠惠. 中国畜牧业绿色全要素生产率的区域差异与收敛性分析[J]. 中国农业科技导报, 2025, 27(11): 72-82.
Add to citation manager EndNote|Ris|BibTeX
URL: https://nkdb.magtechjournal.com/EN/10.13304/j.nykjdb.2025.0603
| 区域类型Regional type | 地区Region |
|---|---|
东北区 Northeast region | 黑龙江、吉林、辽宁 Heilongjiang, Jilin, Liaoning |
华南区 South China region | 福建、广东、海南 Fujian, Guangdong, Hainan |
黄淮海区 Huanghuaihai region | 北京、河北、河南、山东、天津 Beijing, Hebei, Henan, Shandong, Tianjin |
青藏区 Qinghai-Tibet region | 青海、西藏 Qinghai, Tibet |
西北及长城沿线区 Northwest and Great Wall Corridor region | 甘肃、内蒙古、宁夏、山西、陕西、新疆 Gansu, Inner Mongolia, Ningxia, Shanxi, Shaanxi, Xinjiang |
西南区 Southwest region | 广西、贵州、四川、云南、重庆 Guangxi, Guizhou, Sichuan, Yunnan, Chongqing |
长江中下游区 Middle and Lower Yangtze River region | 安徽、湖北、湖南、江苏、江西、上海、浙江 Anhui, Hubei, Hunan, Jiangsu, Jiangxi, Shanghai, Zhejiang |
Table 1 Framework of the 7 major agricultural subregions in China
| 区域类型Regional type | 地区Region |
|---|---|
东北区 Northeast region | 黑龙江、吉林、辽宁 Heilongjiang, Jilin, Liaoning |
华南区 South China region | 福建、广东、海南 Fujian, Guangdong, Hainan |
黄淮海区 Huanghuaihai region | 北京、河北、河南、山东、天津 Beijing, Hebei, Henan, Shandong, Tianjin |
青藏区 Qinghai-Tibet region | 青海、西藏 Qinghai, Tibet |
西北及长城沿线区 Northwest and Great Wall Corridor region | 甘肃、内蒙古、宁夏、山西、陕西、新疆 Gansu, Inner Mongolia, Ningxia, Shanxi, Shaanxi, Xinjiang |
西南区 Southwest region | 广西、贵州、四川、云南、重庆 Guangxi, Guizhou, Sichuan, Yunnan, Chongqing |
长江中下游区 Middle and Lower Yangtze River region | 安徽、湖北、湖南、江苏、江西、上海、浙江 Anhui, Hubei, Hunan, Jiangsu, Jiangxi, Shanghai, Zhejiang |
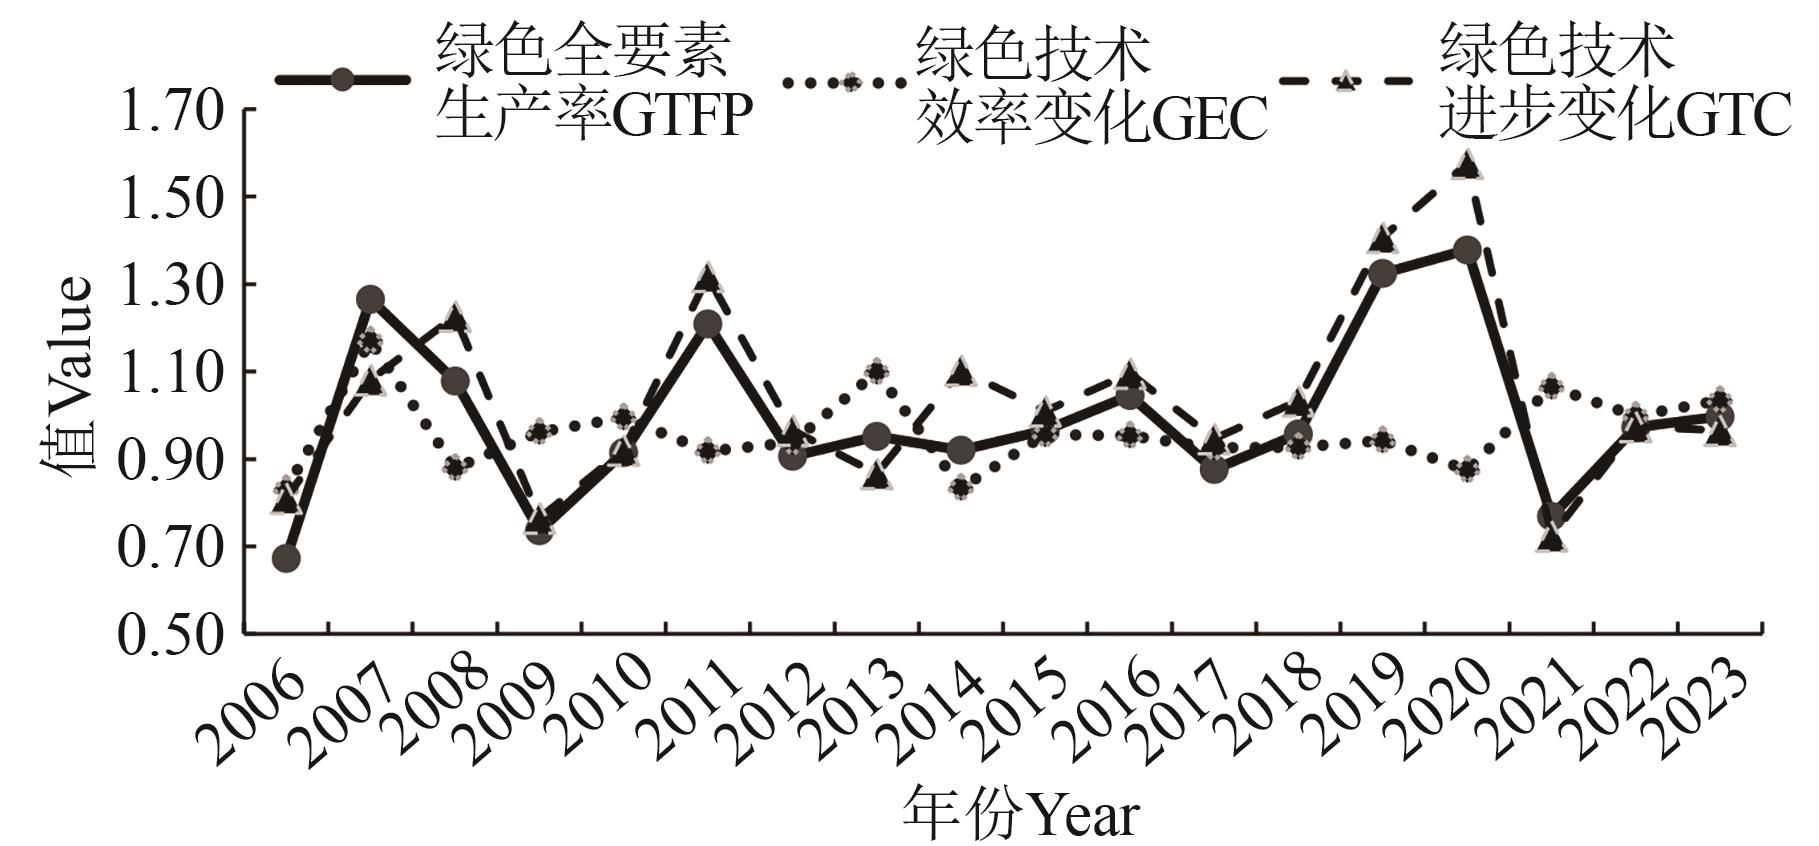
Fig. 1 Green total factor productivity in China’s livestock sector from 2006 to 2023
| 地区 Region | GML指数 GML index | 绿色技术效率变化GEC | 绿色技术进步变化GTC | 地区 Region | GML指数 GML index | 绿色技术效率变化GEC | 绿色技术进步变化GTC |
|---|---|---|---|---|---|---|---|
| 黑龙江 Heilongjiang | 0.968 8 | 0.971 8 | 0.996 9 | 贵州 Guizhou | 0.966 1 | 0.914 7 | 1.056 2 |
| 吉林 Jilin | 0.950 0 | 0.940 6 | 1.010 0 | 四川 Sichuan | 0.942 4 | 0.997 9 | 0.944 4 |
| 辽宁 Liaoning | 0.964 9 | 0.956 7 | 1.008 6 | 云南 Yunnan | 0.945 3 | 0.943 8 | 1.001 6 |
| 福建 Fujian | 1.007 7 | 1.003 8 | 1.003 9 | 重庆 Chongqing | 0.966 3 | 0.939 6 | 1.028 4 |
| 广东 Guangdong | 0.970 2 | 1.003 0 | 0.967 3 | 安徽 Anhui | 0.954 2 | 0.968 1 | 0.985 6 |
| 海南 Hainan | 1.017 3 | 0.949 9 | 1.071 0 | 湖北 Hubei | 0.947 3 | 0.936 7 | 1.011 3 |
| 北京 Beijing | 1.001 9 | 1.006 6 | 0.995 3 | 湖南 Hunan | 1.003 3 | 1.016 5 | 0.987 0 |
| 河北 Hebei | 0.972 2 | 0.963 3 | 1.009 3 | 江苏 Jiangsu | 0.969 3 | 0.999 6 | 0.969 7 |
| 河南 Henan | 1.043 2 | 1.013 6 | 1.029 2 | 江西 Jiangxi | 0.994 6 | 0.988 6 | 1.006 1 |
| 山东 Shandong | 0.982 0 | 1.012 7 | 0.969 8 | 上海 Shanghai | 1.010 2 | 0.974 9 | 1.036 3 |
| 天津 Tianjin | 0.984 5 | 0.930 2 | 1.058 4 | 浙江 Zhejiang | 1.067 1 | 1.010 4 | 1.056 1 |
| 青海 Qinghai | 0.945 2 | 0.900 6 | 1.049 5 | 东北区Northeast region | 0.961 2 | 0.956 3 | 1.005 2 |
| 西藏 Tibet | 0.895 6 | 0.873 3 | 1.025 5 | 华南区 South China region | 0.998 2 | 0.985 2 | 1.013 2 |
| 甘肃 Gansu | 1.007 4 | 0.905 1 | 1.113 1 | 黄淮海区 Huanghuaihai region | 0.996 5 | 0.984 7 | 1.012 0 |
| 内蒙古Inner Mongolia | 0.973 2 | 0.941 1 | 1.034 1 | 青藏区 Qinghai-Tibet region | 0.920 1 | 0.886 9 | 1.037 5 |
| 宁夏 Ningxia | 0.972 8 | 0.873 9 | 1.113 2 | 西北及长城沿线区 Northwest and Great Wall Corridor region | 0.989 5 | 0.919 7 | 1.075 9 |
| 山西 Shanxi | 0.990 4 | 0.938 1 | 1.055 8 | 西南区 Southwest region | 0.954 6 | 0.951 3 | 1.003 4 |
| 陕西 Shaanxi | 0.978 1 | 0.946 3 | 1.033 6 | 长江中下游区 | 0.991 6 | 0.984 6 | 1.007 1 |
| 新疆 Xinjiang | 1.015 8 | 0.915 7 | 1.109 3 | Middle and Lower Yangtze region | |||
| 广西 Guangxi | 0.953 0 | 0.962 7 | 0.990 0 | 全国 China | 0.978 8 | 0.957 2 | 1.022 6 |
Table 2 Green total factor productivity in China’s regional and inter-provincial livestock sector from 2006 to 2023
| 地区 Region | GML指数 GML index | 绿色技术效率变化GEC | 绿色技术进步变化GTC | 地区 Region | GML指数 GML index | 绿色技术效率变化GEC | 绿色技术进步变化GTC |
|---|---|---|---|---|---|---|---|
| 黑龙江 Heilongjiang | 0.968 8 | 0.971 8 | 0.996 9 | 贵州 Guizhou | 0.966 1 | 0.914 7 | 1.056 2 |
| 吉林 Jilin | 0.950 0 | 0.940 6 | 1.010 0 | 四川 Sichuan | 0.942 4 | 0.997 9 | 0.944 4 |
| 辽宁 Liaoning | 0.964 9 | 0.956 7 | 1.008 6 | 云南 Yunnan | 0.945 3 | 0.943 8 | 1.001 6 |
| 福建 Fujian | 1.007 7 | 1.003 8 | 1.003 9 | 重庆 Chongqing | 0.966 3 | 0.939 6 | 1.028 4 |
| 广东 Guangdong | 0.970 2 | 1.003 0 | 0.967 3 | 安徽 Anhui | 0.954 2 | 0.968 1 | 0.985 6 |
| 海南 Hainan | 1.017 3 | 0.949 9 | 1.071 0 | 湖北 Hubei | 0.947 3 | 0.936 7 | 1.011 3 |
| 北京 Beijing | 1.001 9 | 1.006 6 | 0.995 3 | 湖南 Hunan | 1.003 3 | 1.016 5 | 0.987 0 |
| 河北 Hebei | 0.972 2 | 0.963 3 | 1.009 3 | 江苏 Jiangsu | 0.969 3 | 0.999 6 | 0.969 7 |
| 河南 Henan | 1.043 2 | 1.013 6 | 1.029 2 | 江西 Jiangxi | 0.994 6 | 0.988 6 | 1.006 1 |
| 山东 Shandong | 0.982 0 | 1.012 7 | 0.969 8 | 上海 Shanghai | 1.010 2 | 0.974 9 | 1.036 3 |
| 天津 Tianjin | 0.984 5 | 0.930 2 | 1.058 4 | 浙江 Zhejiang | 1.067 1 | 1.010 4 | 1.056 1 |
| 青海 Qinghai | 0.945 2 | 0.900 6 | 1.049 5 | 东北区Northeast region | 0.961 2 | 0.956 3 | 1.005 2 |
| 西藏 Tibet | 0.895 6 | 0.873 3 | 1.025 5 | 华南区 South China region | 0.998 2 | 0.985 2 | 1.013 2 |
| 甘肃 Gansu | 1.007 4 | 0.905 1 | 1.113 1 | 黄淮海区 Huanghuaihai region | 0.996 5 | 0.984 7 | 1.012 0 |
| 内蒙古Inner Mongolia | 0.973 2 | 0.941 1 | 1.034 1 | 青藏区 Qinghai-Tibet region | 0.920 1 | 0.886 9 | 1.037 5 |
| 宁夏 Ningxia | 0.972 8 | 0.873 9 | 1.113 2 | 西北及长城沿线区 Northwest and Great Wall Corridor region | 0.989 5 | 0.919 7 | 1.075 9 |
| 山西 Shanxi | 0.990 4 | 0.938 1 | 1.055 8 | 西南区 Southwest region | 0.954 6 | 0.951 3 | 1.003 4 |
| 陕西 Shaanxi | 0.978 1 | 0.946 3 | 1.033 6 | 长江中下游区 | 0.991 6 | 0.984 6 | 1.007 1 |
| 新疆 Xinjiang | 1.015 8 | 0.915 7 | 1.109 3 | Middle and Lower Yangtze region | |||
| 广西 Guangxi | 0.953 0 | 0.962 7 | 0.990 0 | 全国 China | 0.978 8 | 0.957 2 | 1.022 6 |
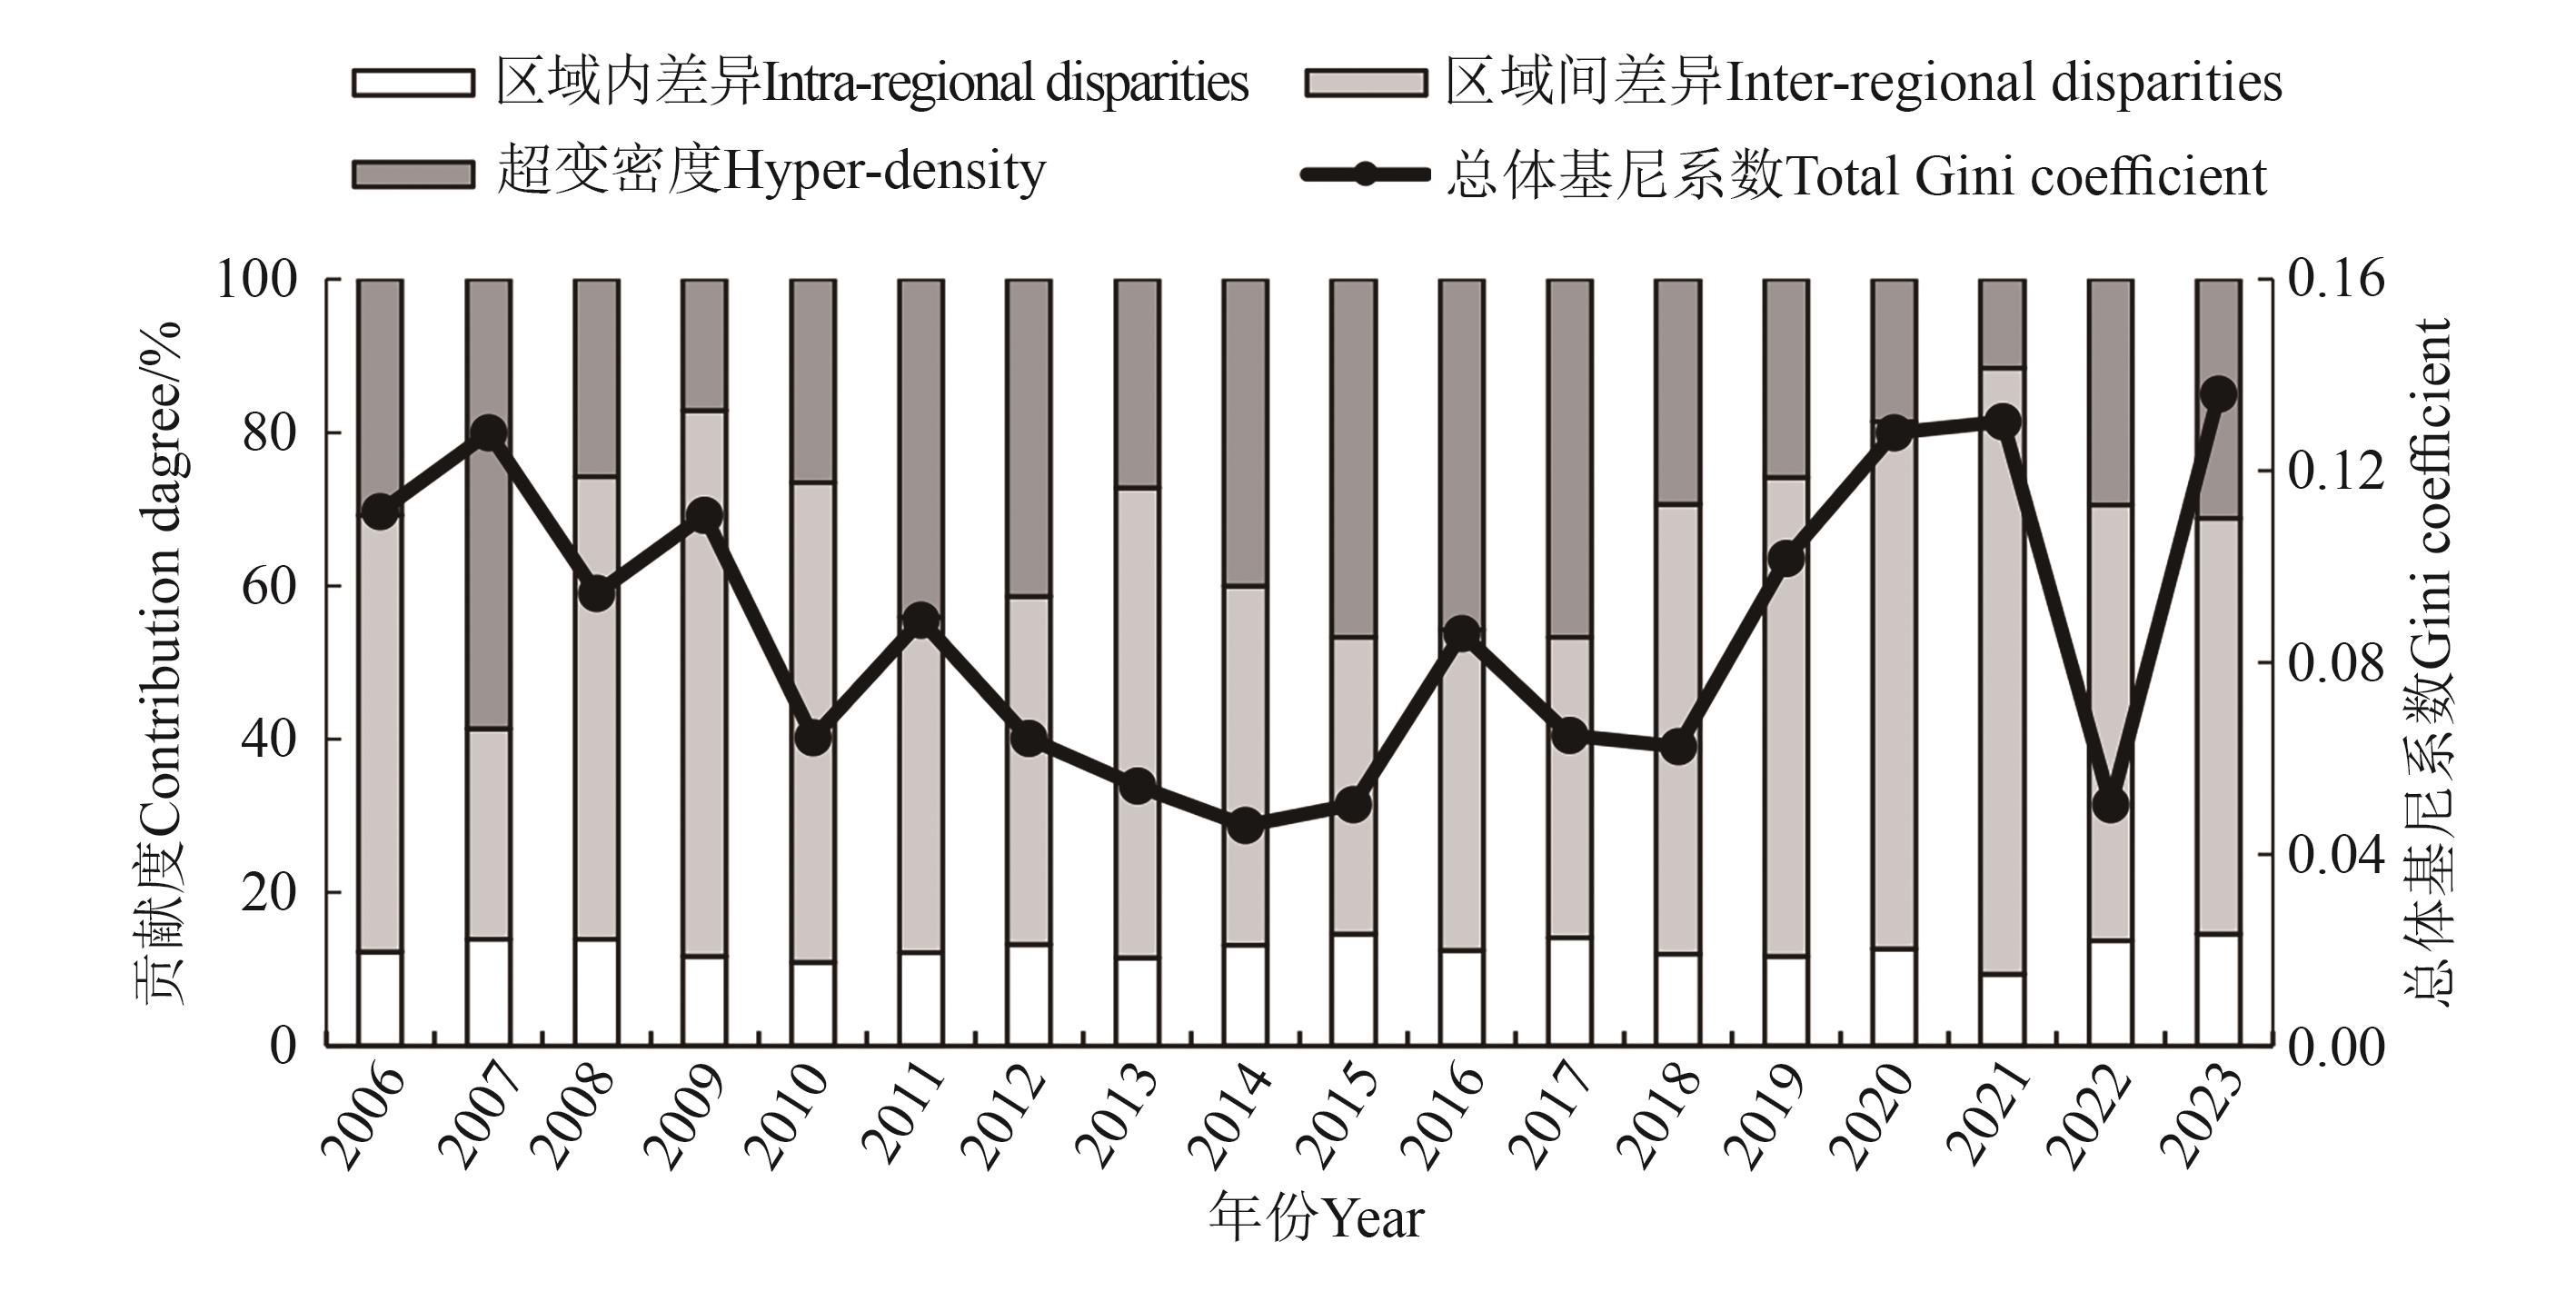
Fig. 2 Overall differences in green total factor productivity and its decomposition in China’s livestock sector from 2006 to 2023
年份 Year | 东北区 Northeast region | 华南区 South China region | 黄淮海区 Huanghuaihai region | 青藏区 Qinghai-Tibet region | 西北及长城沿线区 Northwest and Great Wall Corridor region | 西南区 Southwest region | 长江中下游区 Middle and Lower Yangtze region |
|---|---|---|---|---|---|---|---|
| 2006 | 0.020 | 0.048 | 0.139 | 0.030 | 0.114 | 0.105 | 0.050 |
| 2007 | 0.026 | 0.115 | 0.074 | 0.153 | 0.195 | 0.054 | 0.095 |
| 2008 | 0.048 | 0.059 | 0.055 | 0.007 | 0.080 | 0.031 | 0.118 |
| 2009 | 0.014 | 0.069 | 0.054 | 0.039 | 0.068 | 0.073 | 0.133 |
| 2010 | 0.019 | 0.030 | 0.018 | 0.211 | 0.067 | 0.014 | 0.048 |
| 2011 | 0.008 | 0.050 | 0.126 | 0.094 | 0.034 | 0.030 | 0.086 |
| 2012 | 0.034 | 0.069 | 0.047 | 0.085 | 0.035 | 0.061 | 0.061 |
| 2013 | 0.017 | 0.033 | 0.033 | 0.104 | 0.040 | 0.035 | 0.041 |
| 2014 | 0.012 | 0.033 | 0.022 | 0.011 | 0.032 | 0.056 | 0.048 |
| 2015 | 0.046 | 0.042 | 0.044 | 0.011 | 0.036 | 0.035 | 0.059 |
| 2016 | 0.013 | 0.017 | 0.176 | 0.089 | 0.076 | 0.043 | 0.025 |
| 2017 | 0.017 | 0.029 | 0.093 | 0.003 | 0.036 | 0.048 | 0.075 |
| 2018 | 0.051 | 0.007 | 0.053 | 0.077 | 0.029 | 0.051 | 0.058 |
| 2019 | 0.023 | 0.022 | 0.095 | 0.029 | 0.069 | 0.121 | 0.059 |
| 2020 | 0.085 | 0.040 | 0.057 | 0.050 | 0.044 | 0.090 | 0.157 |
| 2021 | 0.043 | 0.078 | 0.042 | 0.016 | 0.059 | 0.074 | 0.137 |
| 2022 | 0.012 | 0.032 | 0.067 | 0.033 | 0.034 | 0.025 | 0.050 |
| 2023 | 0.016 | 0.017 | 0.156 | 0.040 | 0.051 | 0.084 | 0.183 |
| 均值Mean | 0.028 | 0.044 | 0.075 | 0.060 | 0.061 | 0.057 | 0.082 |
Table 3 Intra-regional Gini coefficients of green total factor productivity in China's livestock sector from 2006 to 2023
年份 Year | 东北区 Northeast region | 华南区 South China region | 黄淮海区 Huanghuaihai region | 青藏区 Qinghai-Tibet region | 西北及长城沿线区 Northwest and Great Wall Corridor region | 西南区 Southwest region | 长江中下游区 Middle and Lower Yangtze region |
|---|---|---|---|---|---|---|---|
| 2006 | 0.020 | 0.048 | 0.139 | 0.030 | 0.114 | 0.105 | 0.050 |
| 2007 | 0.026 | 0.115 | 0.074 | 0.153 | 0.195 | 0.054 | 0.095 |
| 2008 | 0.048 | 0.059 | 0.055 | 0.007 | 0.080 | 0.031 | 0.118 |
| 2009 | 0.014 | 0.069 | 0.054 | 0.039 | 0.068 | 0.073 | 0.133 |
| 2010 | 0.019 | 0.030 | 0.018 | 0.211 | 0.067 | 0.014 | 0.048 |
| 2011 | 0.008 | 0.050 | 0.126 | 0.094 | 0.034 | 0.030 | 0.086 |
| 2012 | 0.034 | 0.069 | 0.047 | 0.085 | 0.035 | 0.061 | 0.061 |
| 2013 | 0.017 | 0.033 | 0.033 | 0.104 | 0.040 | 0.035 | 0.041 |
| 2014 | 0.012 | 0.033 | 0.022 | 0.011 | 0.032 | 0.056 | 0.048 |
| 2015 | 0.046 | 0.042 | 0.044 | 0.011 | 0.036 | 0.035 | 0.059 |
| 2016 | 0.013 | 0.017 | 0.176 | 0.089 | 0.076 | 0.043 | 0.025 |
| 2017 | 0.017 | 0.029 | 0.093 | 0.003 | 0.036 | 0.048 | 0.075 |
| 2018 | 0.051 | 0.007 | 0.053 | 0.077 | 0.029 | 0.051 | 0.058 |
| 2019 | 0.023 | 0.022 | 0.095 | 0.029 | 0.069 | 0.121 | 0.059 |
| 2020 | 0.085 | 0.040 | 0.057 | 0.050 | 0.044 | 0.090 | 0.157 |
| 2021 | 0.043 | 0.078 | 0.042 | 0.016 | 0.059 | 0.074 | 0.137 |
| 2022 | 0.012 | 0.032 | 0.067 | 0.033 | 0.034 | 0.025 | 0.050 |
| 2023 | 0.016 | 0.017 | 0.156 | 0.040 | 0.051 | 0.084 | 0.183 |
| 均值Mean | 0.028 | 0.044 | 0.075 | 0.060 | 0.061 | 0.057 | 0.082 |

Fig. 3 Interregional differences in green total factor productivity in China’s livestock sector from 2006 to 2023
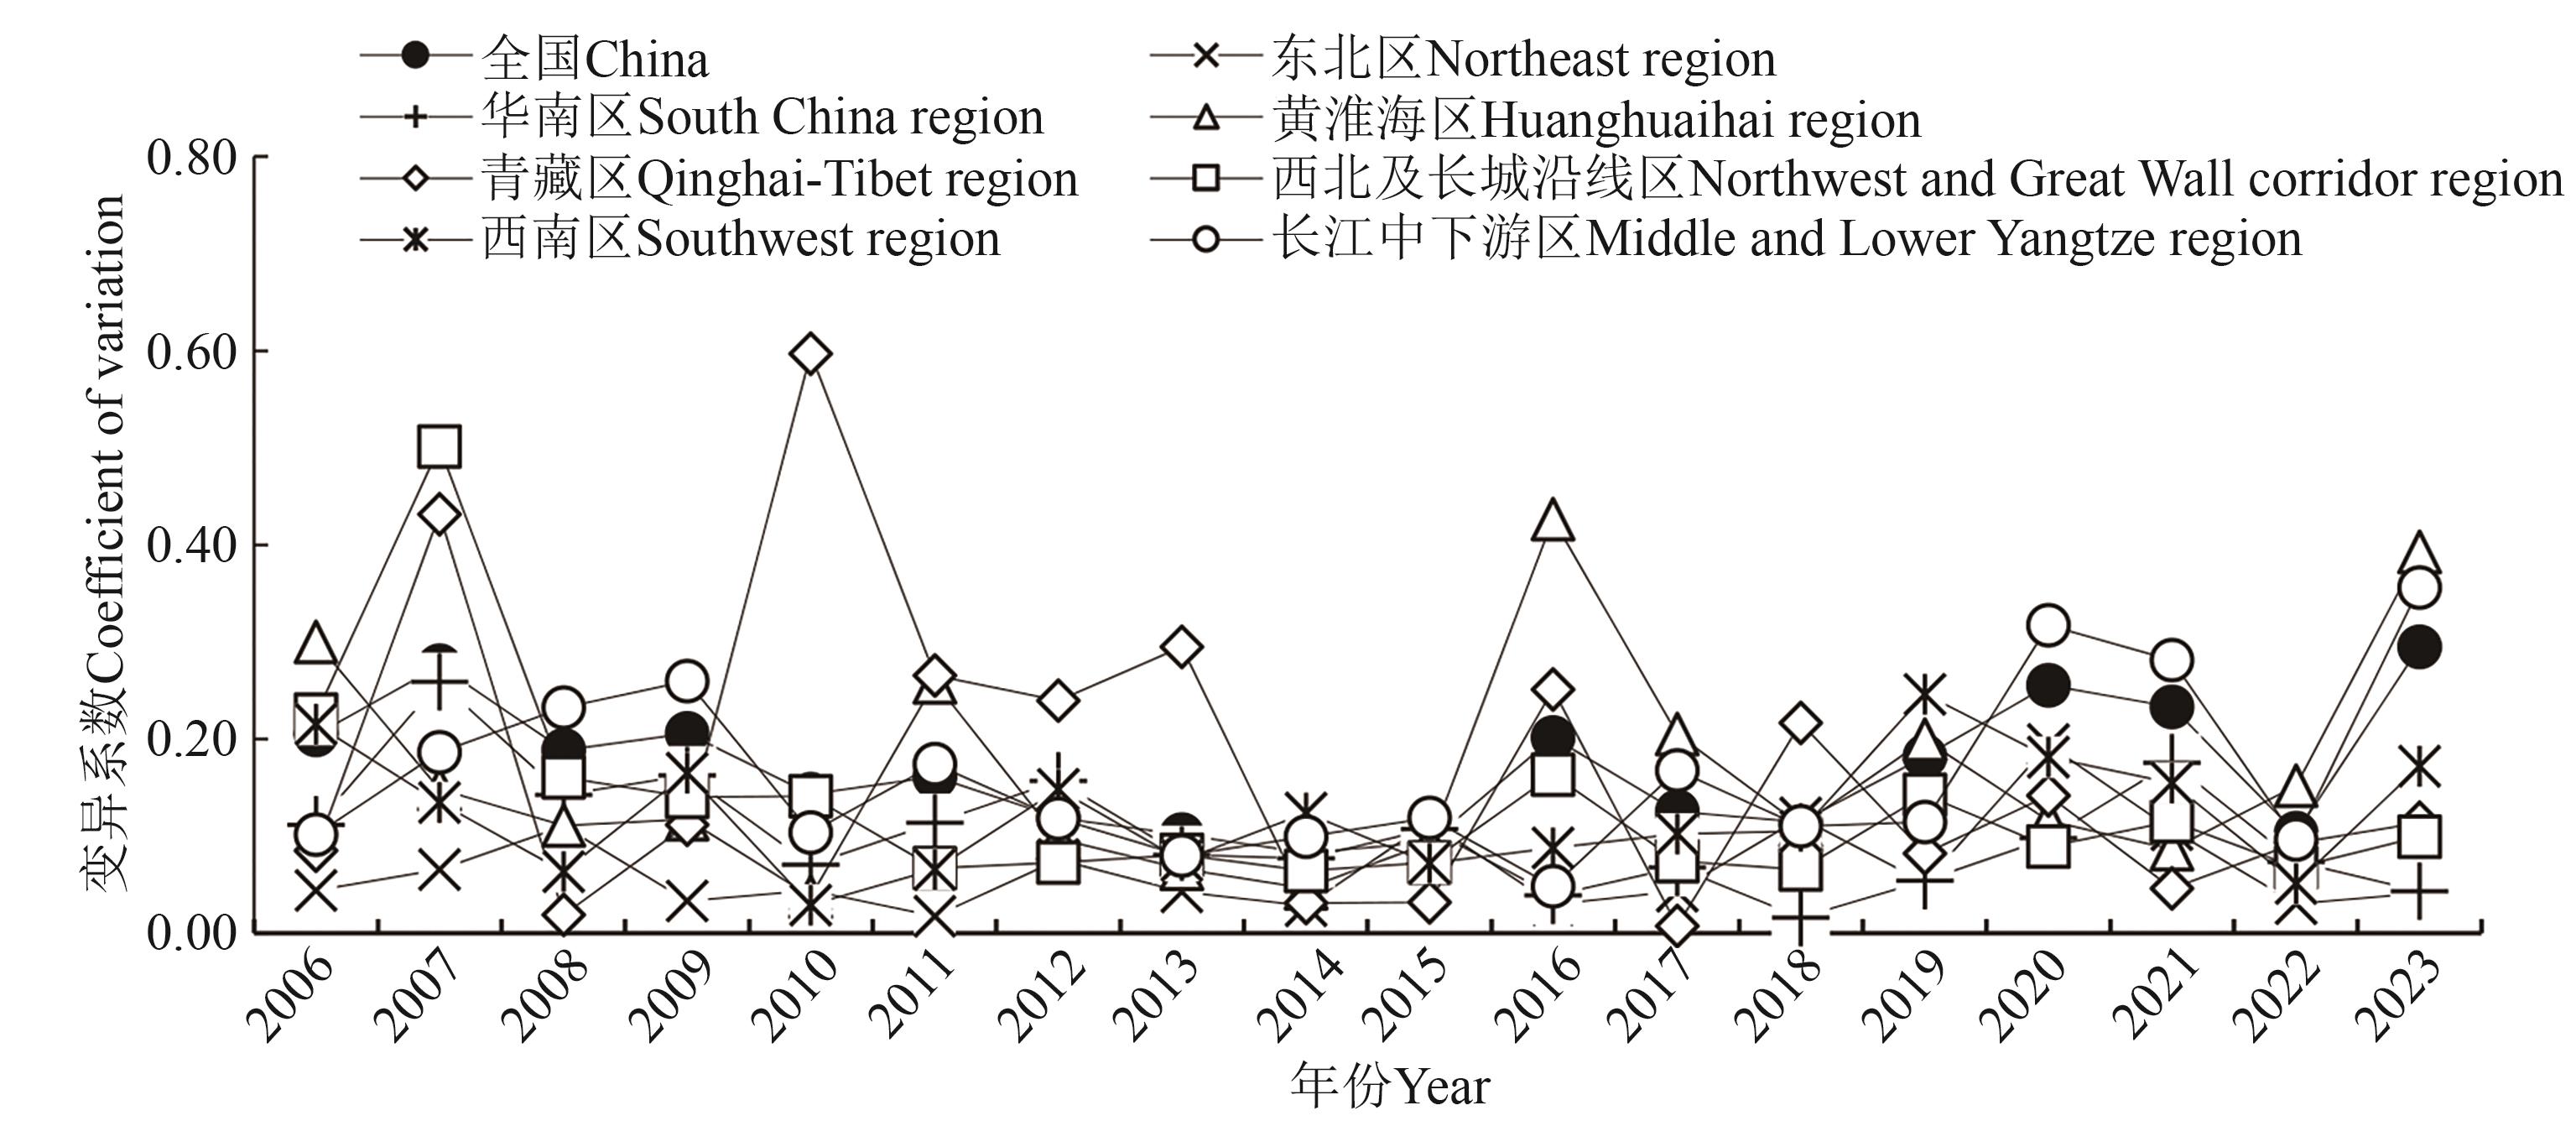
Fig. 4 σ-convergence test for green total factor productivity in the national and 7 regional livestock sector from 2006 to 2023
| 地区Region | β | α | R2 |
|---|---|---|---|
| 全国 China | -0.058±0.003*** | -0.001±0.001 | 0.438 |
| 东北区 Northeast region | -0.063±0.034* | -0.004±0.012 | 0.064 |
| 华南区 South China region | -0.046±0.022** | 0.002±0.005 | 0.078 |
| 西北及长城沿线区 Northwest and Great Wall Corridor region | -0.061±0.005*** | -0.002±0.002 | 0.592 |
| 西南区 Southwest region | -0.059±0.009*** | -0.003±0.003 | 0.355 |
| 长江中下游区Middle and Lower Yangtze region | -0.057±0.017*** | 0.000±0.006 | 0.079 |
| 青藏区 Qinghai-Tibet region | -0.085±0.046* | -0.024±0.033 | 0.093 |
| 黄淮海区 Huanghuaihai region | -0.059±0.005*** | 0.000±0.003 | 0.612 |
Table 4 Absolute β-convergence test results for the whole country and 7 regions
| 地区Region | β | α | R2 |
|---|---|---|---|
| 全国 China | -0.058±0.003*** | -0.001±0.001 | 0.438 |
| 东北区 Northeast region | -0.063±0.034* | -0.004±0.012 | 0.064 |
| 华南区 South China region | -0.046±0.022** | 0.002±0.005 | 0.078 |
| 西北及长城沿线区 Northwest and Great Wall Corridor region | -0.061±0.005*** | -0.002±0.002 | 0.592 |
| 西南区 Southwest region | -0.059±0.009*** | -0.003±0.003 | 0.355 |
| 长江中下游区Middle and Lower Yangtze region | -0.057±0.017*** | 0.000±0.006 | 0.079 |
| 青藏区 Qinghai-Tibet region | -0.085±0.046* | -0.024±0.033 | 0.093 |
| 黄淮海区 Huanghuaihai region | -0.059±0.005*** | 0.000±0.003 | 0.612 |
| 地区Region | β | α | R2 |
|---|---|---|---|
| 全国 China | -1.093±0.052*** | -0.022±0.000*** | 0.800 |
| 东北区 Northeast region | -1.138±0.138** | -0.039±0.003*** | 0.900 |
| 华南区 South China region | -0.991±0.100** | 0.005±0.001** | 0.931 |
| 西北及长城沿线区 Northwest and Great Wall Corridor region | -1.181±0.096*** | -0.006±0.001*** | 0.772 |
| 西南区 Southwest region | -0.853±0.127*** | -0.038±0.004*** | 0.907 |
| 长江中下游区Middle and Lower Yangtze region | -1.059±0.093*** | -0.018±0.001*** | 0.888 |
| 青藏区 Qinghai-Tibet region | -1.196±0.000*** | -0.095±0.000*** | 0.845 |
| 黄淮海区 Huanghuaihai region | -1.112±0.109*** | -0.006±0.003 | 0.801 |
Table 5 Results of conditional β-convergence tests for the whole country and 7 regions
| 地区Region | β | α | R2 |
|---|---|---|---|
| 全国 China | -1.093±0.052*** | -0.022±0.000*** | 0.800 |
| 东北区 Northeast region | -1.138±0.138** | -0.039±0.003*** | 0.900 |
| 华南区 South China region | -0.991±0.100** | 0.005±0.001** | 0.931 |
| 西北及长城沿线区 Northwest and Great Wall Corridor region | -1.181±0.096*** | -0.006±0.001*** | 0.772 |
| 西南区 Southwest region | -0.853±0.127*** | -0.038±0.004*** | 0.907 |
| 长江中下游区Middle and Lower Yangtze region | -1.059±0.093*** | -0.018±0.001*** | 0.888 |
| 青藏区 Qinghai-Tibet region | -1.196±0.000*** | -0.095±0.000*** | 0.845 |
| 黄淮海区 Huanghuaihai region | -1.112±0.109*** | -0.006±0.003 | 0.801 |
| [1] | 中华人民共和国国家统计局. 中国统计年鉴[M]. 北京: 中国统计出版社, 2024: 374. |
| [2] | 中华人民共和国生态环境部应对气候变化司. 《中华人民共和国气候变化第一次双年透明度报告》[R/OL].(2025-01-10)[2025-08-05]. . |
| [3] | 戴小文, 李金花, 何艳秋, 等. 2000—2020年中国畜牧业区域碳排放公平性与排放效率[J]. 资源科学, 2023, 45(1):62-76. |
| DAI X W, LI J H, HE Y Q, et al.. Regional equity and efficiency of carbon emissions of China’s livestock industry in 2000—2020 [J]. Resour. Sci., 2023, 45(1): 62-76 . | |
| [4] | 中共中央办公厅, 国务院办公厅. 《关于创新体制机制推进农业绿色发展的意见》[EB/OL].(2017-09-30)[2025-08-05]. . |
| [5] | 中共中央办公厅, 国务院办公厅.《关于加快经济社会发展全面绿色转型的意见》[EB/OL].(2024-08-11). [2025-08-05] . |
| [6] | 郭家堂. 公共数据开放与中国绿色全要素生产率:数据要素的视角[J]. 经济研究, 2025, 60(2): 56-72. |
| GUO J T. Public data openness and China’s green total factor productivity: a perspective of data factor [J]. Econ. Res. J., 2025, 60(2): 56-72. | |
| [7] | ZHANG X, ZHANG X. Total factor productivity of herdsmen animal husbandry in pastoral areas: regional differences and driving factors [J/OL]. Sustainability, 2022, 14(22): 15347 [2025-08-05]. . |
| [8] | 莫媛, 林丽泰, 孙光林. 数字普惠金融对县域全要素生产率的影响及机制分析[J]. 统计与决策, 2023, 39(23): 162-167. |
| [9] | 孟祥海, 周海川, 杜丽永, 等. 中国农业环境技术效率与绿色全要素生产率增长变迁——基于种养结合视角的再考察[J].农业经济问题, 2019, (6): 9-22. |
| MENG X H, ZHOU H C, DU L Y, et al.. The Change of agricultural environmental technology efficiency and green total factor productivity growth in China: re-examination based on the perspective of combination of planting and breeding [J]. Issu. Agric. Econ. , 2019, (6): 9-22. | |
| [10] | LI Y, SUN R, RAO Y. Digital technology and green total factor productivity [J]. Pol. J. Environ. Stud., 2024, 33(2): 1251-1265. |
| [11] | 夏晓平, 李秉龙, 隋艳颖. 中国畜牧业生产结构的区域差异分析——基于资源禀赋与粮食安全视角[J]. 资源科学, 2010, 32(8): 1592-1600. |
| XIA X P, LI B L, SUI Y Y. Analysis of regional differentiation of animal husbandry production structure in China from the perspectives of resources endowment and food security [J]. Resour. Sci., 2010, 32(8): 1592-1600. | |
| [12] | 田云, 廖华. 两阶段视角下中国农业绿色发展效率测度、演进特征及空间溢出效应[J].中国人口·资源与环境, 2024, 34(10): 160-172. |
| TIAN Y, LIAO H. Efficiency measurement, evolution characteristics and spatial spillover effects of agriculture green development in China from a two-stage perspective [J]. China Population Resour. Environ., 2024, 34(10): 160-172. | |
| [13] | 黄少安, 孙圣民, 宫明波. 中国土地产权制度对农业经济增长的影响——对1949—1978年中国大陆农业生产效率的实证分析[J]. 中国社会科学, 2005(3): 38-47, 205-206. |
| HUANG S A, SUN S M, GONG M B. The impact of land ownership structure on agricultural economic growth: an empirical analysis on agricultural production efficiency on the Chinese mainland (1949—1978) [J]. Soc. Sci. China, 2005(3): 38-47,205-206. | |
| [14] | 王宝义, 张卫国. 中国农业生态效率的省际差异和影响因素——基于1996—2015年31个省份的面板数据分析[J]. 中国农村经济, 2018(1): 46-62. |
| WANG B Y, ZHANG W G. Cross-provincial differences in determinants of agricultural eco-efficiency in China: an analysis based on panel data from 31 provinces in 1996—2015 [J]. Chin. Rural Econ., 2018 (1): 46-62. | |
| [15] | 李谷成, 范丽霞, 冯中朝. 资本积累、制度变迁与农业增长——对1978—2011年中国农业增长与资本存量的实证估计[J]. 管理世界, 2014(5): 67-79, 92. |
| LI G C, FAN L X, FENG Z Z. Capital accumulation, institutional change, and agricultural growth-empirical estimation of agricultural growth and capital stock in China from 1978 to 2011 [J]. J. Manage. World, 2014(5): 67-79, 92. | |
| [16] | 葛鹏飞, 王颂吉, 黄秀路. 中国农业绿色全要素生产率测算[J].中国人口·资源与环境, 2018, 28(5): 66-74. |
| GE P F, WANG S J, HUANG X L. Measurement for China’s agricultural green TFP [J]. China Population Resour. Environ., 2018, 28(5): 66-74. | |
| [17] | IPCC. IPCC guidelines for national greenhouse gas inventories volume 4: agriculture, forestry and other land use [R]. Geneva: Switzerland: IPCC, 2006. |
| [18] | 胡向东, 王济民. 中国畜禽温室气体排放量估算[J]. 农业工程学报, 2010, 26(10): 247-252. |
| HU X D, WANG J M. Estimation of livestock greenhouse gases discharge in China [J]. Trans. Chin. Soc. Agric. Eng., 2010, 26(10): 247-252. | |
| [19] | TONE K. Dealing with undesirable outputs in DEA: a slacks-based measure (SBM) approach [C]//The Operations Research Society of Japan, 2004: 44-45. |
| [20] | 王少剑, 高爽, 黄永源, 等. 基于超效率SBM模型的中国城市碳排放绩效时空演变格局及预测[J]. 地理学报,2020, 75(6): 1316-1330. |
| WANG S J, GAO S, HUANG Y Y, et al.. Spatio-temporal evolution and trend prediction of urban carbon emission performance in China based on super-efficiency SBM model [J]. Acta Geographica Sin., 2020, 75(6): 1316-1330. | |
| [21] | 田伟, 杨璐嘉, 姜静. 低碳视角下中国农业环境效率的测算与分析——基于非期望产出的SBM模型[J]. 中国农村观察,2014(5): 59-71. |
| TIAN W, YANG L J, JIANG J. Measurement and analysis of the Chinese agricultural eco-efficiency from the perspective of low carbon: based on SBM model of the undesirable outputs [J]. China Rural Survey, 2014(5): 59-71. | |
| [22] | 王文举, 孔晓旭. 基于2030年碳达峰目标的中国省域碳配额分配研究[J]. 数量经济技术经济研究, 2022, 39(7):113-132. |
| WANG W J, KONG X X. Analysis on China’s provincial carbon quota allocation based on the 2030 carbon peak goal [J]. J. Quant. Technol. Econ., 2022, 39(7): 113-132. | |
| [23] | OH D H. A global Malmquist-Luenberger productivity index [J]. J. Prod. Anal., 2010, 34(3): 183-197. |
| [24] | WANG Z, XU X, ZHU Y, et al.. Evaluation of carbon emission efficiency in China’s airlines [J/OL]. J. Clean. Prod., 2020, 243: 118500 [2025-08-05]. . |
| [25] | 王小华, 贺文瑾. 数字普惠金融发展的时空特征及其动力机制研究[J]. 农业经济问题, 2024(1): 16-33. |
| WANG X H, HE W J. Research on the spatial-temporal features and dynamic mechanism of digital inclusive finance development [J]. Issues Agric. Econ., 2024(1): 16-33. | |
| [26] | 李阳, 杨艳芬.“双碳”目标背景下奶牛养殖绿色发展研究[J].中国乳业, 2025(7): 46-50. |
| LI Y, YANG Y F. Research on green development of dairy cattle farming under the background of dual carbon target [J]. China Dairy, 2025(7): 46-50. | |
| [27] | 刘继芳, 周向阳, 李敏, 等. 人工智能驱动畜牧新质生产力高质量发展: 制约因素、生成逻辑与推进路径[J]. 智慧农业(中英文), 2025, 7(1): 165-177. |
| LIU J F. ZHOU X Y, LI M,et al.. Artificial intelligence-driven high-quality development of new-quality productivity in animal husbandry: restraining factors, generation logic and promotion paths [J]. Smart Agric., 2025, 7(1): 165-177. | |
| [28] | 苏淑娴, 郑冰.“双碳”背景下中国乳业发展现状及对策研究[J].中国乳业, 2024(9): 21-25. |
| SU S X, ZHENG B. Study on the development status and countermeasures of China’s dairy industry under the background of double carbon [J]. China Dairy, 2024, (9): 21-25. | |
| [29] | 杨印生, 韦鑫. 低碳农业机械化的发展逻辑、影响因素与实现路径[J]. 智慧农业(中英文), 2023, 5(4): 150-159. |
| YANG Y S, WEI X. The development logic, influencing factors and realization path for low-carbon agricultural mechanization [J]. Smart Agric., 2023, 5(4): 150-159. |
| [1] | Xiao WANG, Xiangfei XIN, Yan YAN, Jimin WANG. Analysis of Evolution Characteristics and Driving Factors of Carbon Emission from Animal Husbandry in Shandong Province [J]. Journal of Agricultural Science and Technology, 2025, 27(8): 155-167. |
| [2] | Fan YANG, Qingning LIN, Qi WANG, Shiping MAO. Exploration on Intelligent Path of Animal Husbandry from Perspective of Metauniverse [J]. Journal of Agricultural Science and Technology, 2024, 26(8): 1-8. |
| [3] | Huanhuan ZHANG, Guogang WANG, Yongxiang ZHANG, Shuai HAO. Characteristics and Causes of Regional Variation of Grain Production Capacity in China [J]. Journal of Agricultural Science and Technology, 2023, 25(1): 6-15. |
| [4] | Zhaohui ZHANG, Yifan JI, Zejun HE. Evolution in the Spatio-temporal Pattern on Animal Husbandry Green Development Competitiveness in China [J]. Journal of Agricultural Science and Technology, 2022, 24(9): 12-23. |
| [5] | Zhenjia HE, Tongle SHI, Yuliang FU, Liangjun FEI. Effect of Emitter Spacing on Nitrogen Transport Characteristics of Intersecting Two Point Sources in Bubbled-root Irrigation [J]. Journal of Agricultural Science and Technology, 2022, 24(5): 157-169. |
| [6] | Xuezhen XIONG, Chun YANG, Xiaoping MA. Situation of China's Animal Husbandry Development and High-quality Development Strategy Selection [J]. Journal of Agricultural Science and Technology, 2022, 24(3): 1-10. |
| [7] | XUE Pengfei1, LIU Shuang1, LIN Qingning2*. Spatial Distribution of Agricultural Research Talents in China and Its Impact on Agricultural High-quality Development [J]. Journal of Agricultural Science and Technology, 2021, 23(4): 1-10. |
| [8] | TANG Xiaopeng, CHEN Lei, XIONG Kangning*. Application Prospect of EM Bacteria in Agricultural Production of Guizhou Karst Region [J]. Journal of Agricultural Science and Technology, 2020, 22(4): 129-138. |
| [9] | CHEN Hui-ping, ZHANG Yan-rong*, HUANG Bing-kai. An Empirical Study on Factors Affecting Herbivorous Animal Husbandry Competitiveness based on Co-integration Analysis ——Taking Gansu Province as a Case [J]. Journal of Agricultural Science and Technology, 2016, 18(2): 192-199. |
| [10] | ZHANG Yingjun1, REN Jizhou2, WANG Mingli3, YANG Gaowen1. Discussion on the Position and Development Distribution of Forage Industry in Chinas Agricultural Industry Structure [J]. , 2013, 15(4): 61-71. |
| [11] | Alamus, WU Hong-xin, XIA Ming. Brief Discussion on Grass Products Safety and its Influence Factors [J]. , 2009, 11(S1): 82-86. |
| [12] | GU Xian-hong . Welfare Raising is Basic Requirement for Organic Animal Husbandry [J]. , 2007, 9(5): 63-67. |
| Viewed | ||||||
|
Full text |
|
|||||
|
Abstract |
|
|||||
 京公网安备11010802021197号