


Journal of Agricultural Science and Technology ›› 2025, Vol. 27 ›› Issue (10): 180-192.DOI: 10.13304/j.nykjdb.2024.0272
• BIO-MANUFACTURING & RESOURCE AND ECOLOGY • Previous Articles
Huayan LIU1,2( ), Yanyan SHEN1, Jiale ZHENG1, Luhao ZHANG1, Xiangyun YANG1, Yanbing QI1(
 )
)
Received:2024-04-03
Accepted:2024-07-13
Online:2025-10-15
Published:2025-10-15
Contact:
Yanbing QI
刘华岩1,2( ), 申严岩1, 郑佳乐1, 张路豪1, 杨香云1, 齐雁冰1(
 )
)
通讯作者:
齐雁冰
作者简介:刘华岩 E-mail:18630707731@163.com;
基金资助:CLC Number:
Huayan LIU, Yanyan SHEN, Jiale ZHENG, Luhao ZHANG, Xiangyun YANG, Yanbing QI. Safety Assessment of Cultivated Land Production and Zoning of Potential Productivity Improvement in North China Plain[J]. Journal of Agricultural Science and Technology, 2025, 27(10): 180-192.
刘华岩, 申严岩, 郑佳乐, 张路豪, 杨香云, 齐雁冰. 华北平原耕地生产安全评价及生产潜力提升分区[J]. 中国农业科技导报, 2025, 27(10): 180-192.
Add to citation manager EndNote|Ris|BibTeX
URL: https://nkdb.magtechjournal.com/EN/10.13304/j.nykjdb.2024.0272
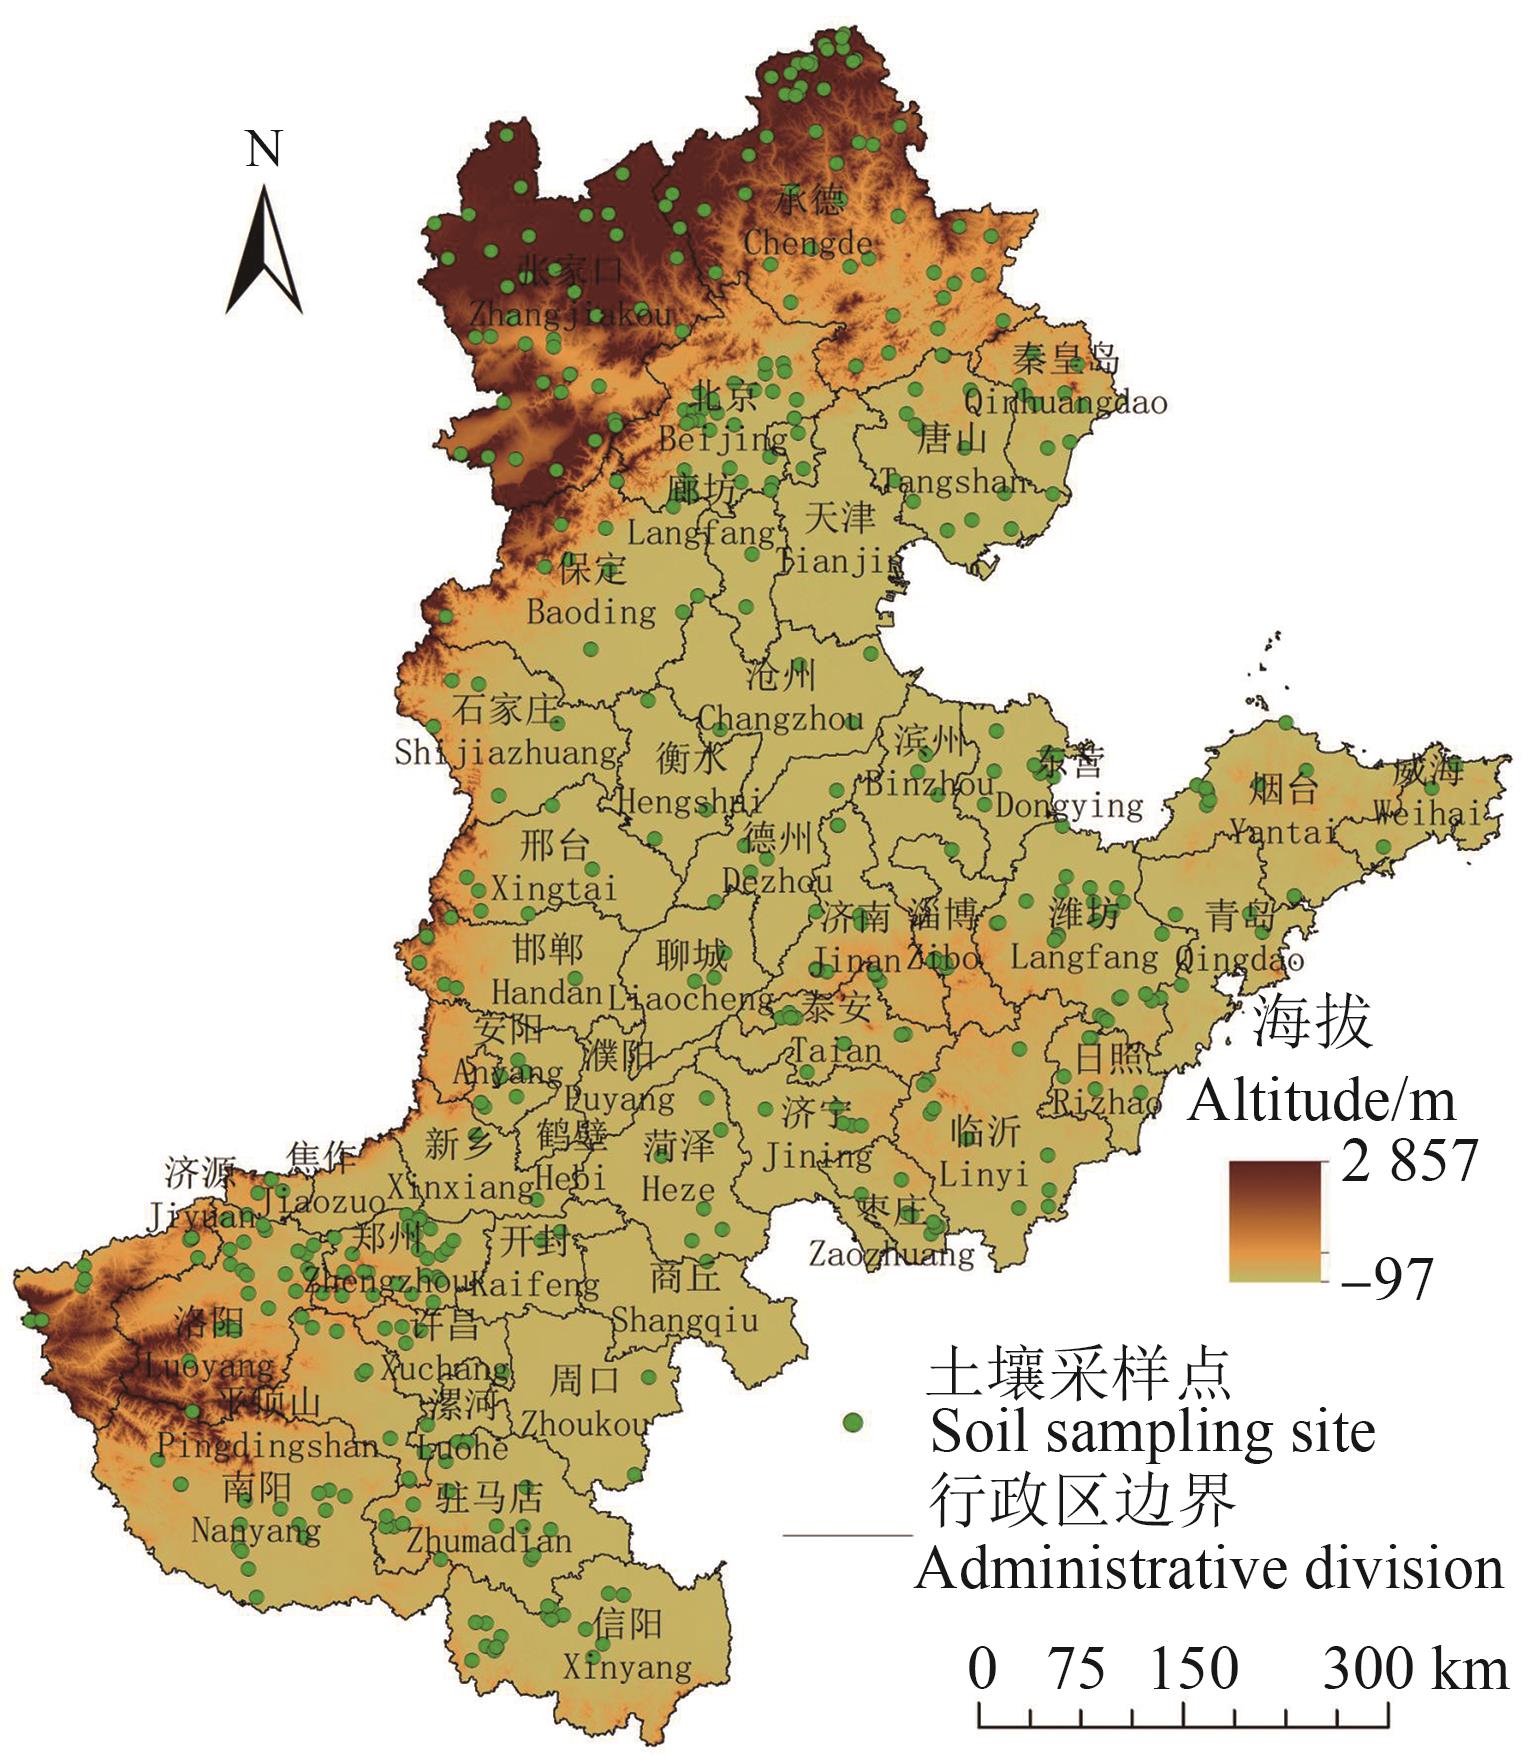
Fig. 1 Extent and soil sample sites of North China PlainNote:The map is based on the standard map of GS(2019)1822 downloaded from the standard map service website of the Map Technology Review Center of the Ministry of Natural Resources, and the base map is not modified.
指标 Index | 分级 Grade | ||||
|---|---|---|---|---|---|
| 一级Level 1 | 二级Level 2 | 三级Level 3 | 四级Level 4 | 五级Level 5 | |
土壤质地 Soil texture | 壤土 Loam (1.0) | 黏壤土 Clay loam (0.9) | 砂壤土 Sandy loam (0.8) | 黏土 Clay (0.7) | 砂土 Sandy soil (0.5) |
土壤有机质 Soil organic matter/(g·kg-1) | >40 (1.0) | (30, 40] (0.9) | (20, 30] (0.8) | (10, 20] (0.7) | ≤10 (0.3) |
土壤pH Soil pH | [6.5, 7.5) (1.0) | [6.0, 6.5), [7.5, 8.0)(0.9) | [5.5, 6.0), [8.0, 8.5) (0.7) | [4.0, 5.5), [8.5, 9.0) (0.5) | <4.0, ≥9.0 (0.3) |
土壤全氮量 Total soil nitrogen content/(g·kg-1) | >2.0 (1.0) | (1.5, 2.0] (0.9) | (1.0, 1.5] (0.8) | (0.5, 1.0] (0.7) | ≤0.5 (0.6) |
| 高程Elevation/m | ≤200 (1.0) | (200, 500] (0.9) | (500, 900] (0.6) | (900, 1 300] (0.5) | >1 300 (0.3) |
| 坡度Slope/(°) | ≤2 (1.0) | (2, 6] (0.9) | (6, 15] (0.6) | (15, 25] (0.4) | >25 (0.2) |
| 坡向Aspect | 平地, 正南 Flat, south (1.0) | 西南, 东南 Southwest, southeast (0.9) | 正西, 正东 West, east (0.8) | 西北, 东北 Northwest, northeast (0.7) | 正北 North (0.6) |
年均气温 Annual average temperature/℃ | >15 (1.0) | (13, 15] (0.9) | (10, 13] (0.8) | (5, 10] (0.6) | ≤5 (0.4) |
年均降水量 Annual average precipitation/mm | >700 (1.0) | (600, 700] (0.9) | (500, 600] (0.8) | (400, 500] (0.6) | ≤400 (0.4) |
年均日照时数 Annual average sunshine duration/h | >2 600 (1.0) | (2 400, 2 600] (0.9) | (2 200, 2 400] (0.8) | (2 000, 2 200] (0.6) | ≤2 000 (0.4) |
年均地表温度 Annual average surface temperature/℃ | >40 (1.0) | (35, 40] (0.9) | (30, 35] (0.8) | (25, 30] (0.6) | ≤25 (0.4) |
灌溉保证率 Irrigation assurance rate/% | >60 (1.0) | (50, 60] (0.9) | (40, 50] (0.8) | (30, 40] (0.7) | ≤30 (0.5) |
地均农业机械总动力 Total agricultural machinery power per unit area/(kW·hm-2) | >140 (1.0) | (110, 140] (0.9) | (80, 110] (0.8) | (50, 80] (0.7) | ≤50 (0.6) |
地均化肥施用量 Fertilizer application rate per unit area/(t·hm-2) | >0.8 (1.0) | (0.6, 0.8] (0.9) | (0.4, 0.6] (0.8) | (0.2, 0.4] (0.7) | ≤0.2 (0.6) |
路网密度 Road network density/(km·hm-2) | >8 (1.0) | (5, 8] (0.9) | (3, 5] (0.8) | (2, 3] (0.7) | ≤2 (0.6) |
Table 1 Classification of impact indicators and corresponding scores for cropland production safety assessment
指标 Index | 分级 Grade | ||||
|---|---|---|---|---|---|
| 一级Level 1 | 二级Level 2 | 三级Level 3 | 四级Level 4 | 五级Level 5 | |
土壤质地 Soil texture | 壤土 Loam (1.0) | 黏壤土 Clay loam (0.9) | 砂壤土 Sandy loam (0.8) | 黏土 Clay (0.7) | 砂土 Sandy soil (0.5) |
土壤有机质 Soil organic matter/(g·kg-1) | >40 (1.0) | (30, 40] (0.9) | (20, 30] (0.8) | (10, 20] (0.7) | ≤10 (0.3) |
土壤pH Soil pH | [6.5, 7.5) (1.0) | [6.0, 6.5), [7.5, 8.0)(0.9) | [5.5, 6.0), [8.0, 8.5) (0.7) | [4.0, 5.5), [8.5, 9.0) (0.5) | <4.0, ≥9.0 (0.3) |
土壤全氮量 Total soil nitrogen content/(g·kg-1) | >2.0 (1.0) | (1.5, 2.0] (0.9) | (1.0, 1.5] (0.8) | (0.5, 1.0] (0.7) | ≤0.5 (0.6) |
| 高程Elevation/m | ≤200 (1.0) | (200, 500] (0.9) | (500, 900] (0.6) | (900, 1 300] (0.5) | >1 300 (0.3) |
| 坡度Slope/(°) | ≤2 (1.0) | (2, 6] (0.9) | (6, 15] (0.6) | (15, 25] (0.4) | >25 (0.2) |
| 坡向Aspect | 平地, 正南 Flat, south (1.0) | 西南, 东南 Southwest, southeast (0.9) | 正西, 正东 West, east (0.8) | 西北, 东北 Northwest, northeast (0.7) | 正北 North (0.6) |
年均气温 Annual average temperature/℃ | >15 (1.0) | (13, 15] (0.9) | (10, 13] (0.8) | (5, 10] (0.6) | ≤5 (0.4) |
年均降水量 Annual average precipitation/mm | >700 (1.0) | (600, 700] (0.9) | (500, 600] (0.8) | (400, 500] (0.6) | ≤400 (0.4) |
年均日照时数 Annual average sunshine duration/h | >2 600 (1.0) | (2 400, 2 600] (0.9) | (2 200, 2 400] (0.8) | (2 000, 2 200] (0.6) | ≤2 000 (0.4) |
年均地表温度 Annual average surface temperature/℃ | >40 (1.0) | (35, 40] (0.9) | (30, 35] (0.8) | (25, 30] (0.6) | ≤25 (0.4) |
灌溉保证率 Irrigation assurance rate/% | >60 (1.0) | (50, 60] (0.9) | (40, 50] (0.8) | (30, 40] (0.7) | ≤30 (0.5) |
地均农业机械总动力 Total agricultural machinery power per unit area/(kW·hm-2) | >140 (1.0) | (110, 140] (0.9) | (80, 110] (0.8) | (50, 80] (0.7) | ≤50 (0.6) |
地均化肥施用量 Fertilizer application rate per unit area/(t·hm-2) | >0.8 (1.0) | (0.6, 0.8] (0.9) | (0.4, 0.6] (0.8) | (0.2, 0.4] (0.7) | ≤0.2 (0.6) |
路网密度 Road network density/(km·hm-2) | >8 (1.0) | (5, 8] (0.9) | (3, 5] (0.8) | (2, 3] (0.7) | ≤2 (0.6) |
条件层 Condition layer | 因子层 Factor layer | 因子层权重 Weight of factor layer | 综合权重 Composite weight |
|---|---|---|---|
土壤条件 Soil condition (0.38) | 土壤质地 Soil texture | 0.29 | 0.11 |
土壤有机质 Soil organic matter | 0.32 | 0.12 | |
土壤pH Soil pH | 0.22 | 0.09 | |
土壤全氮量 Total soil nitrogen content | 0.17 | 0.06 | |
立地条件 Site condition (0.21) | 高程 Elevation | 0.39 | 0.08 |
坡度 Slope | 0.29 | 0.06 | |
坡向 Aspect | 0.32 | 0.07 | |
气候条件 Climatic condition (0.20) | 年均气温 Annual average temperature | 0.24 | 0.05 |
年均降水量 Annual average precipitation | 0.25 | 0.05 | |
年均日照时数 Annual average sunshine duration | 0.32 | 0.06 | |
年均地表温度 Annual average surface temperature | 0.19 | 0.04 | |
生产条件 Production condition (0.21) | 灌溉保证率 Irrigation assurance rate | 0.30 | 0.07 |
地均农业机械总动力 Total agricultural machinery power per unit area | 0.21 | 0.04 | |
地均化肥施用量 Fertilizer application rate per unit area | 0.24 | 0.05 | |
路网密度 Road network density | 0.25 | 0.05 |
Table 2 Weight of indicators for cropland production safety assessment
条件层 Condition layer | 因子层 Factor layer | 因子层权重 Weight of factor layer | 综合权重 Composite weight |
|---|---|---|---|
土壤条件 Soil condition (0.38) | 土壤质地 Soil texture | 0.29 | 0.11 |
土壤有机质 Soil organic matter | 0.32 | 0.12 | |
土壤pH Soil pH | 0.22 | 0.09 | |
土壤全氮量 Total soil nitrogen content | 0.17 | 0.06 | |
立地条件 Site condition (0.21) | 高程 Elevation | 0.39 | 0.08 |
坡度 Slope | 0.29 | 0.06 | |
坡向 Aspect | 0.32 | 0.07 | |
气候条件 Climatic condition (0.20) | 年均气温 Annual average temperature | 0.24 | 0.05 |
年均降水量 Annual average precipitation | 0.25 | 0.05 | |
年均日照时数 Annual average sunshine duration | 0.32 | 0.06 | |
年均地表温度 Annual average surface temperature | 0.19 | 0.04 | |
生产条件 Production condition (0.21) | 灌溉保证率 Irrigation assurance rate | 0.30 | 0.07 |
地均农业机械总动力 Total agricultural machinery power per unit area | 0.21 | 0.04 | |
地均化肥施用量 Fertilizer application rate per unit area | 0.24 | 0.05 | |
路网密度 Road network density | 0.25 | 0.05 |
可改良性 Improvisability | 特征 Attribute | 限制因子类型 Type of limiting factor |
|---|---|---|
易改良型 Easy type | 响应时间较短, 人为干扰程度较高, 限制因子改良难度小 Short response time and high degree of human interference, easy in improving limiting factors | 灌溉保证率, 地均农业机械总动力, 地均化肥施用量, 路网密度, 土壤pH, 土壤全氮, 土壤有机质 Irrigation assurance rate, total agricultural machinery power per unit area, fertilizer application rate per unit area, road network density, soil pH, total soil nitrogen content, soil organic matter |
难改良型 Diffcult type | 响应时间较长, 人为干扰程度较低, 限制因子改良难度大 Long response time and low degree of human interference, difficult in improving limiting factors | 年均气温, 年均降水量, 年均日照时数, 年均地表温度, 土壤质地, 高程, 坡度, 坡向 Annual average temperature, annual average precipitation, annual average sunshine duration, annual average surface temperature, soil texture, elevation, slope, aspect |
Table 3 Classification of limiting factors with amenable attributes
可改良性 Improvisability | 特征 Attribute | 限制因子类型 Type of limiting factor |
|---|---|---|
易改良型 Easy type | 响应时间较短, 人为干扰程度较高, 限制因子改良难度小 Short response time and high degree of human interference, easy in improving limiting factors | 灌溉保证率, 地均农业机械总动力, 地均化肥施用量, 路网密度, 土壤pH, 土壤全氮, 土壤有机质 Irrigation assurance rate, total agricultural machinery power per unit area, fertilizer application rate per unit area, road network density, soil pH, total soil nitrogen content, soil organic matter |
难改良型 Diffcult type | 响应时间较长, 人为干扰程度较低, 限制因子改良难度大 Long response time and low degree of human interference, difficult in improving limiting factors | 年均气温, 年均降水量, 年均日照时数, 年均地表温度, 土壤质地, 高程, 坡度, 坡向 Annual average temperature, annual average precipitation, annual average sunshine duration, annual average surface temperature, soil texture, elevation, slope, aspect |
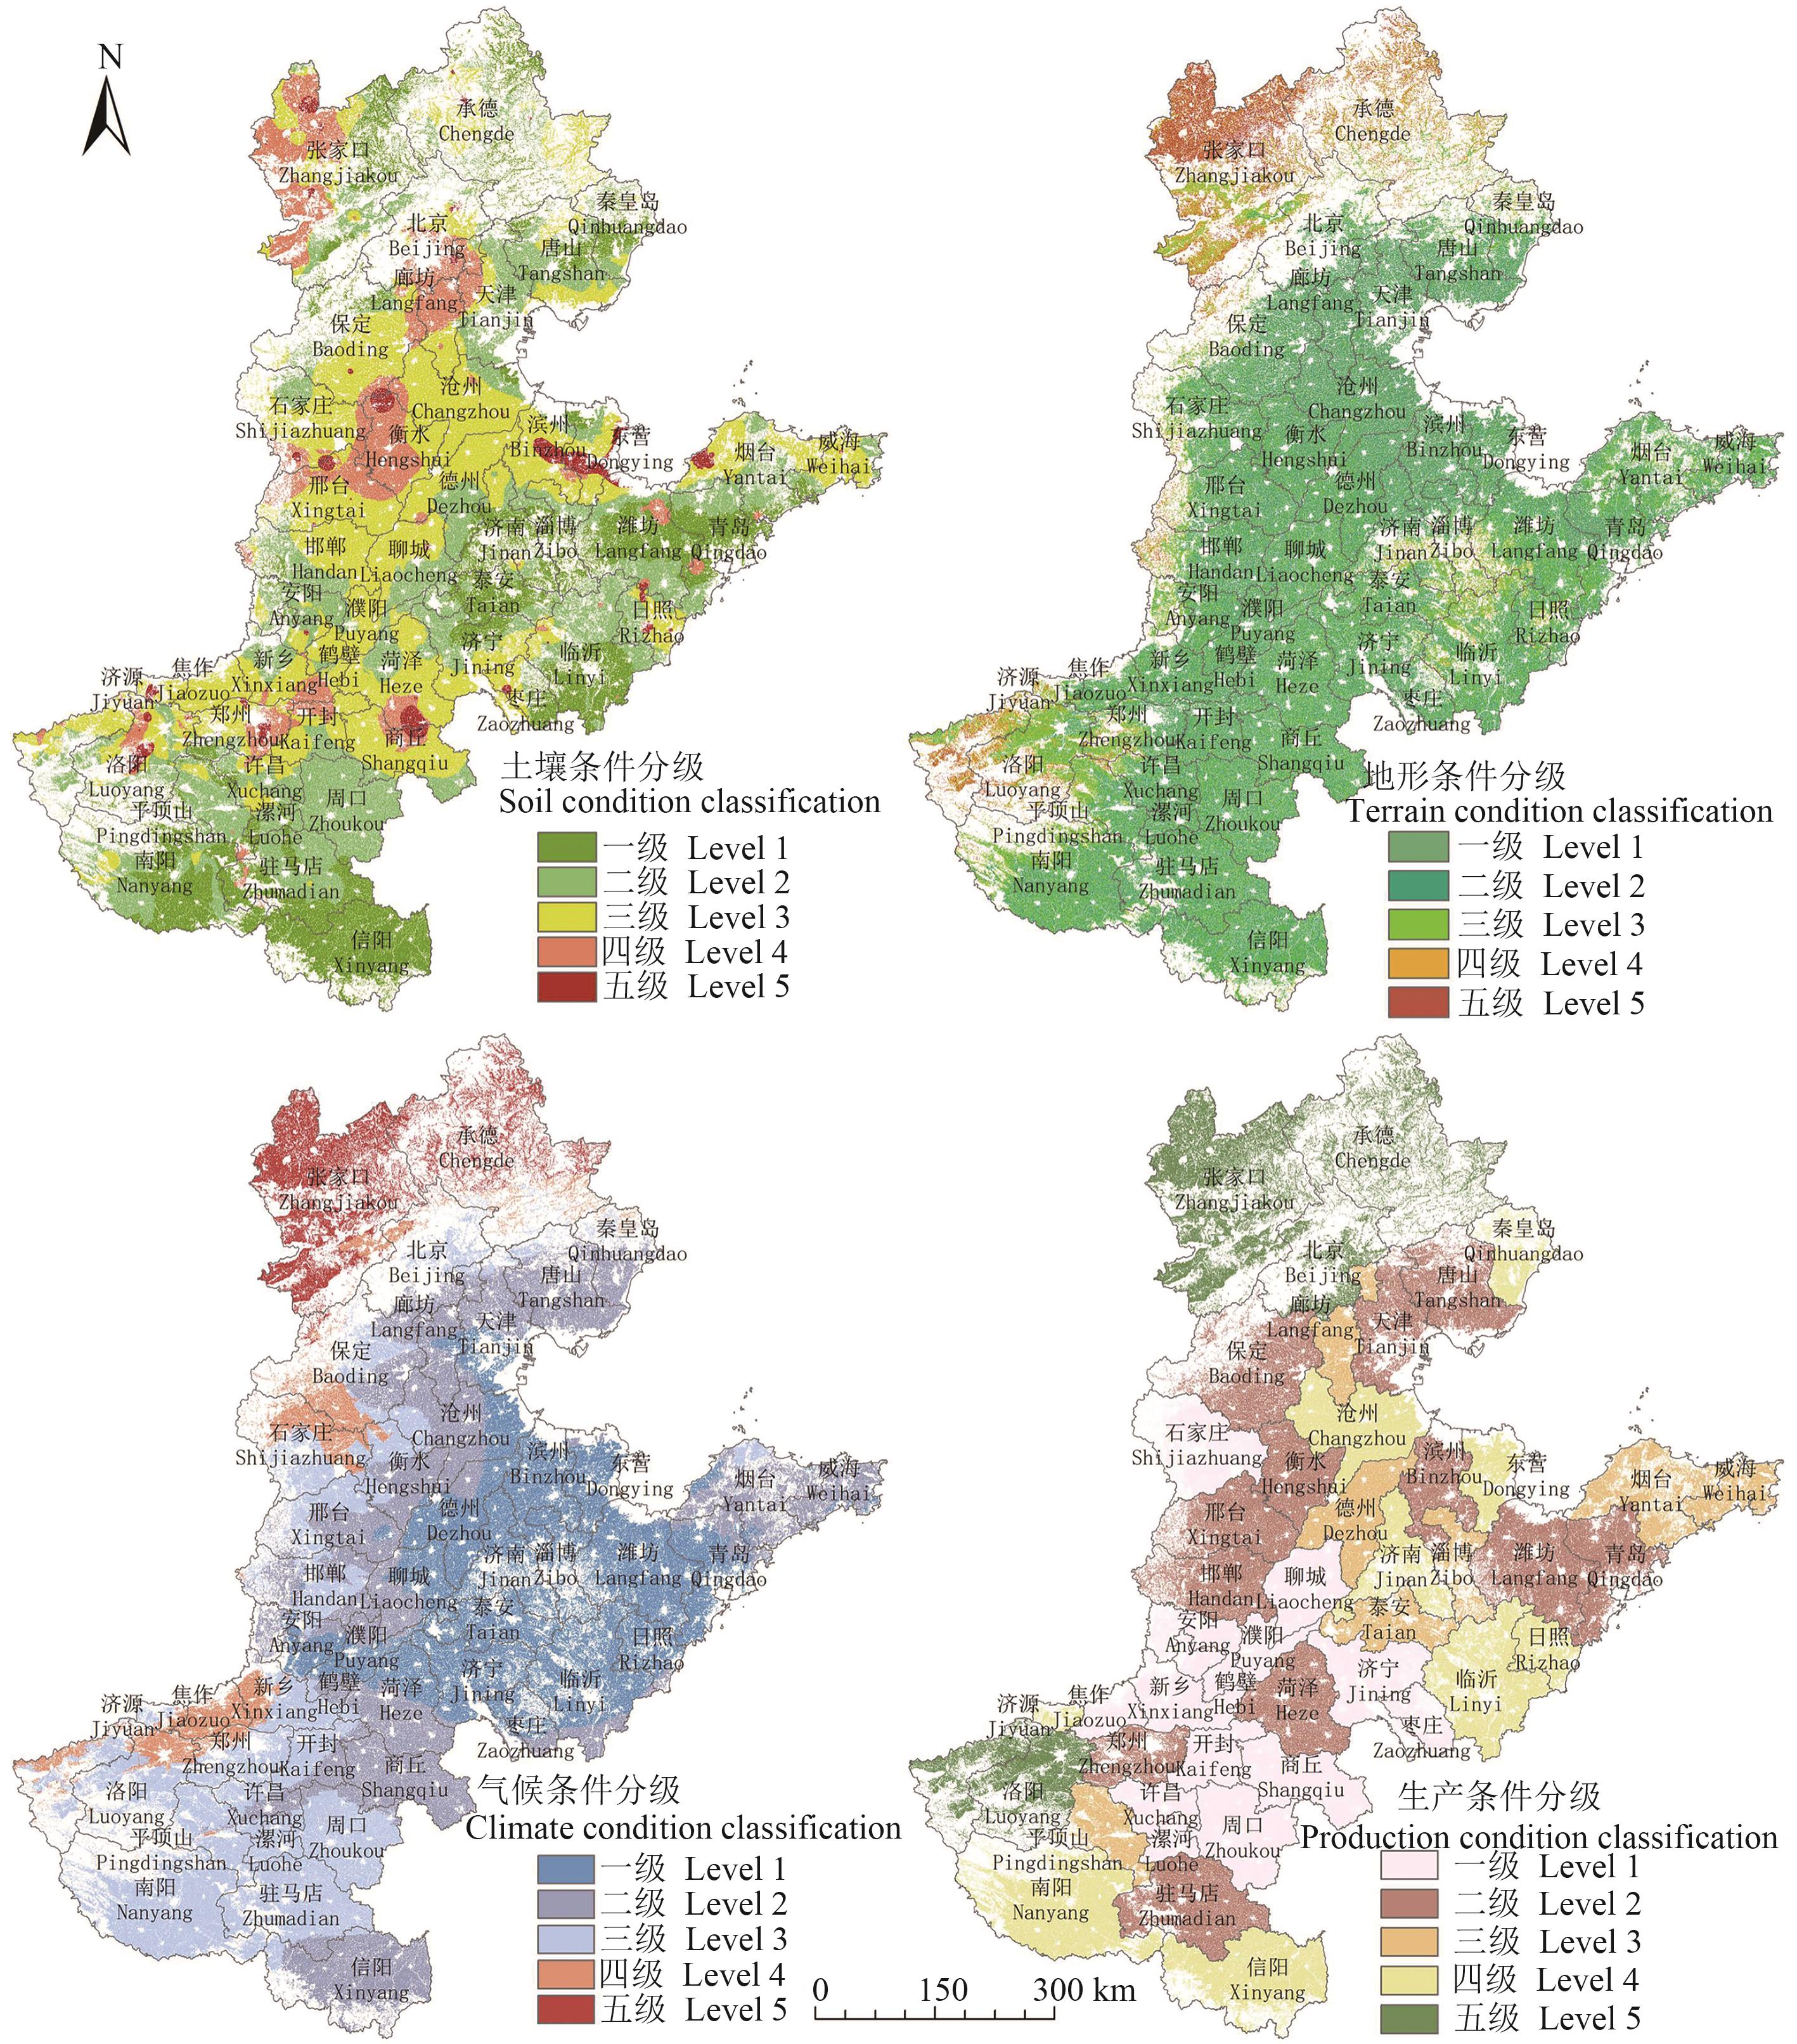
Fig. 2 Classification of different index conditions in north China plainNote:The map is based on the standard map of GS(2019)1822 downloaded from the standard map service website of the Map Technology Review Center of the Ministry of Natural Resources, and the base map is not modified。
等级 Grade | 指标 Index | 北京 Beijing | 天津 Tianjin | 河北 Hebei | 山东 Shandong | 河南 Henan | 总计 Total |
|---|---|---|---|---|---|---|---|
极高度安全 Extremely high safety | 面积Area/hm2 | 3.73 | 217 310.97 | 598 604.49 | 3 600 761.99 | 2 243 237.67 | 6 659 918.85 |
| 占比Percentage/% | 0.00 | 0.71 | 1.96 | 11.78 | 7.34 | 21.79 | |
高度安全 High safety | 面积Area/hm2 | 15 602.87 | 367 303.94 | 4 778 525.86 | 5 958 930.07 | 6 345 405.07 | 17 465 767.81 |
| 占比Percentage/% | 0.05 | 1.20 | 15.63 | 19.49 | 20.76 | 57.14 | |
中度安全 Moderate safety | 面积Area/hm2 | 296 504.21 | 12 061.09 | 1 224 709.02 | 557 569.97 | 1 187 952.26 | 3 278 796.55 |
| 占比Percentage/% | 0.97 | 0.04 | 4.01 | 1.82 | 3.89 | 10.73 | |
低度安全 Low safety | 面积Area/hm2 | 60 562.19 | 0.46 | 832 167.66 | 24 879.90 | 560 151.52 | 1 477 761.73 |
| 占比Percentage/% | 0.20 | 0.00 | 2.72 | 0.08 | 1.83 | 4.83 | |
极低度安全 Very low safety | 面积Area/hm2 | 756.63 | 0.00 | 1 618 208.43 | 0.09 | 66 650.85 | 1 685 616.00 |
| 占比Percentage/% | 0.00 | 0.00 | 5.29 | 0.00 | 0.22 | 5.51 |
Table 4 Cropland production safety grades across provinces
等级 Grade | 指标 Index | 北京 Beijing | 天津 Tianjin | 河北 Hebei | 山东 Shandong | 河南 Henan | 总计 Total |
|---|---|---|---|---|---|---|---|
极高度安全 Extremely high safety | 面积Area/hm2 | 3.73 | 217 310.97 | 598 604.49 | 3 600 761.99 | 2 243 237.67 | 6 659 918.85 |
| 占比Percentage/% | 0.00 | 0.71 | 1.96 | 11.78 | 7.34 | 21.79 | |
高度安全 High safety | 面积Area/hm2 | 15 602.87 | 367 303.94 | 4 778 525.86 | 5 958 930.07 | 6 345 405.07 | 17 465 767.81 |
| 占比Percentage/% | 0.05 | 1.20 | 15.63 | 19.49 | 20.76 | 57.14 | |
中度安全 Moderate safety | 面积Area/hm2 | 296 504.21 | 12 061.09 | 1 224 709.02 | 557 569.97 | 1 187 952.26 | 3 278 796.55 |
| 占比Percentage/% | 0.97 | 0.04 | 4.01 | 1.82 | 3.89 | 10.73 | |
低度安全 Low safety | 面积Area/hm2 | 60 562.19 | 0.46 | 832 167.66 | 24 879.90 | 560 151.52 | 1 477 761.73 |
| 占比Percentage/% | 0.20 | 0.00 | 2.72 | 0.08 | 1.83 | 4.83 | |
极低度安全 Very low safety | 面积Area/hm2 | 756.63 | 0.00 | 1 618 208.43 | 0.09 | 66 650.85 | 1 685 616.00 |
| 占比Percentage/% | 0.00 | 0.00 | 5.29 | 0.00 | 0.22 | 5.51 |
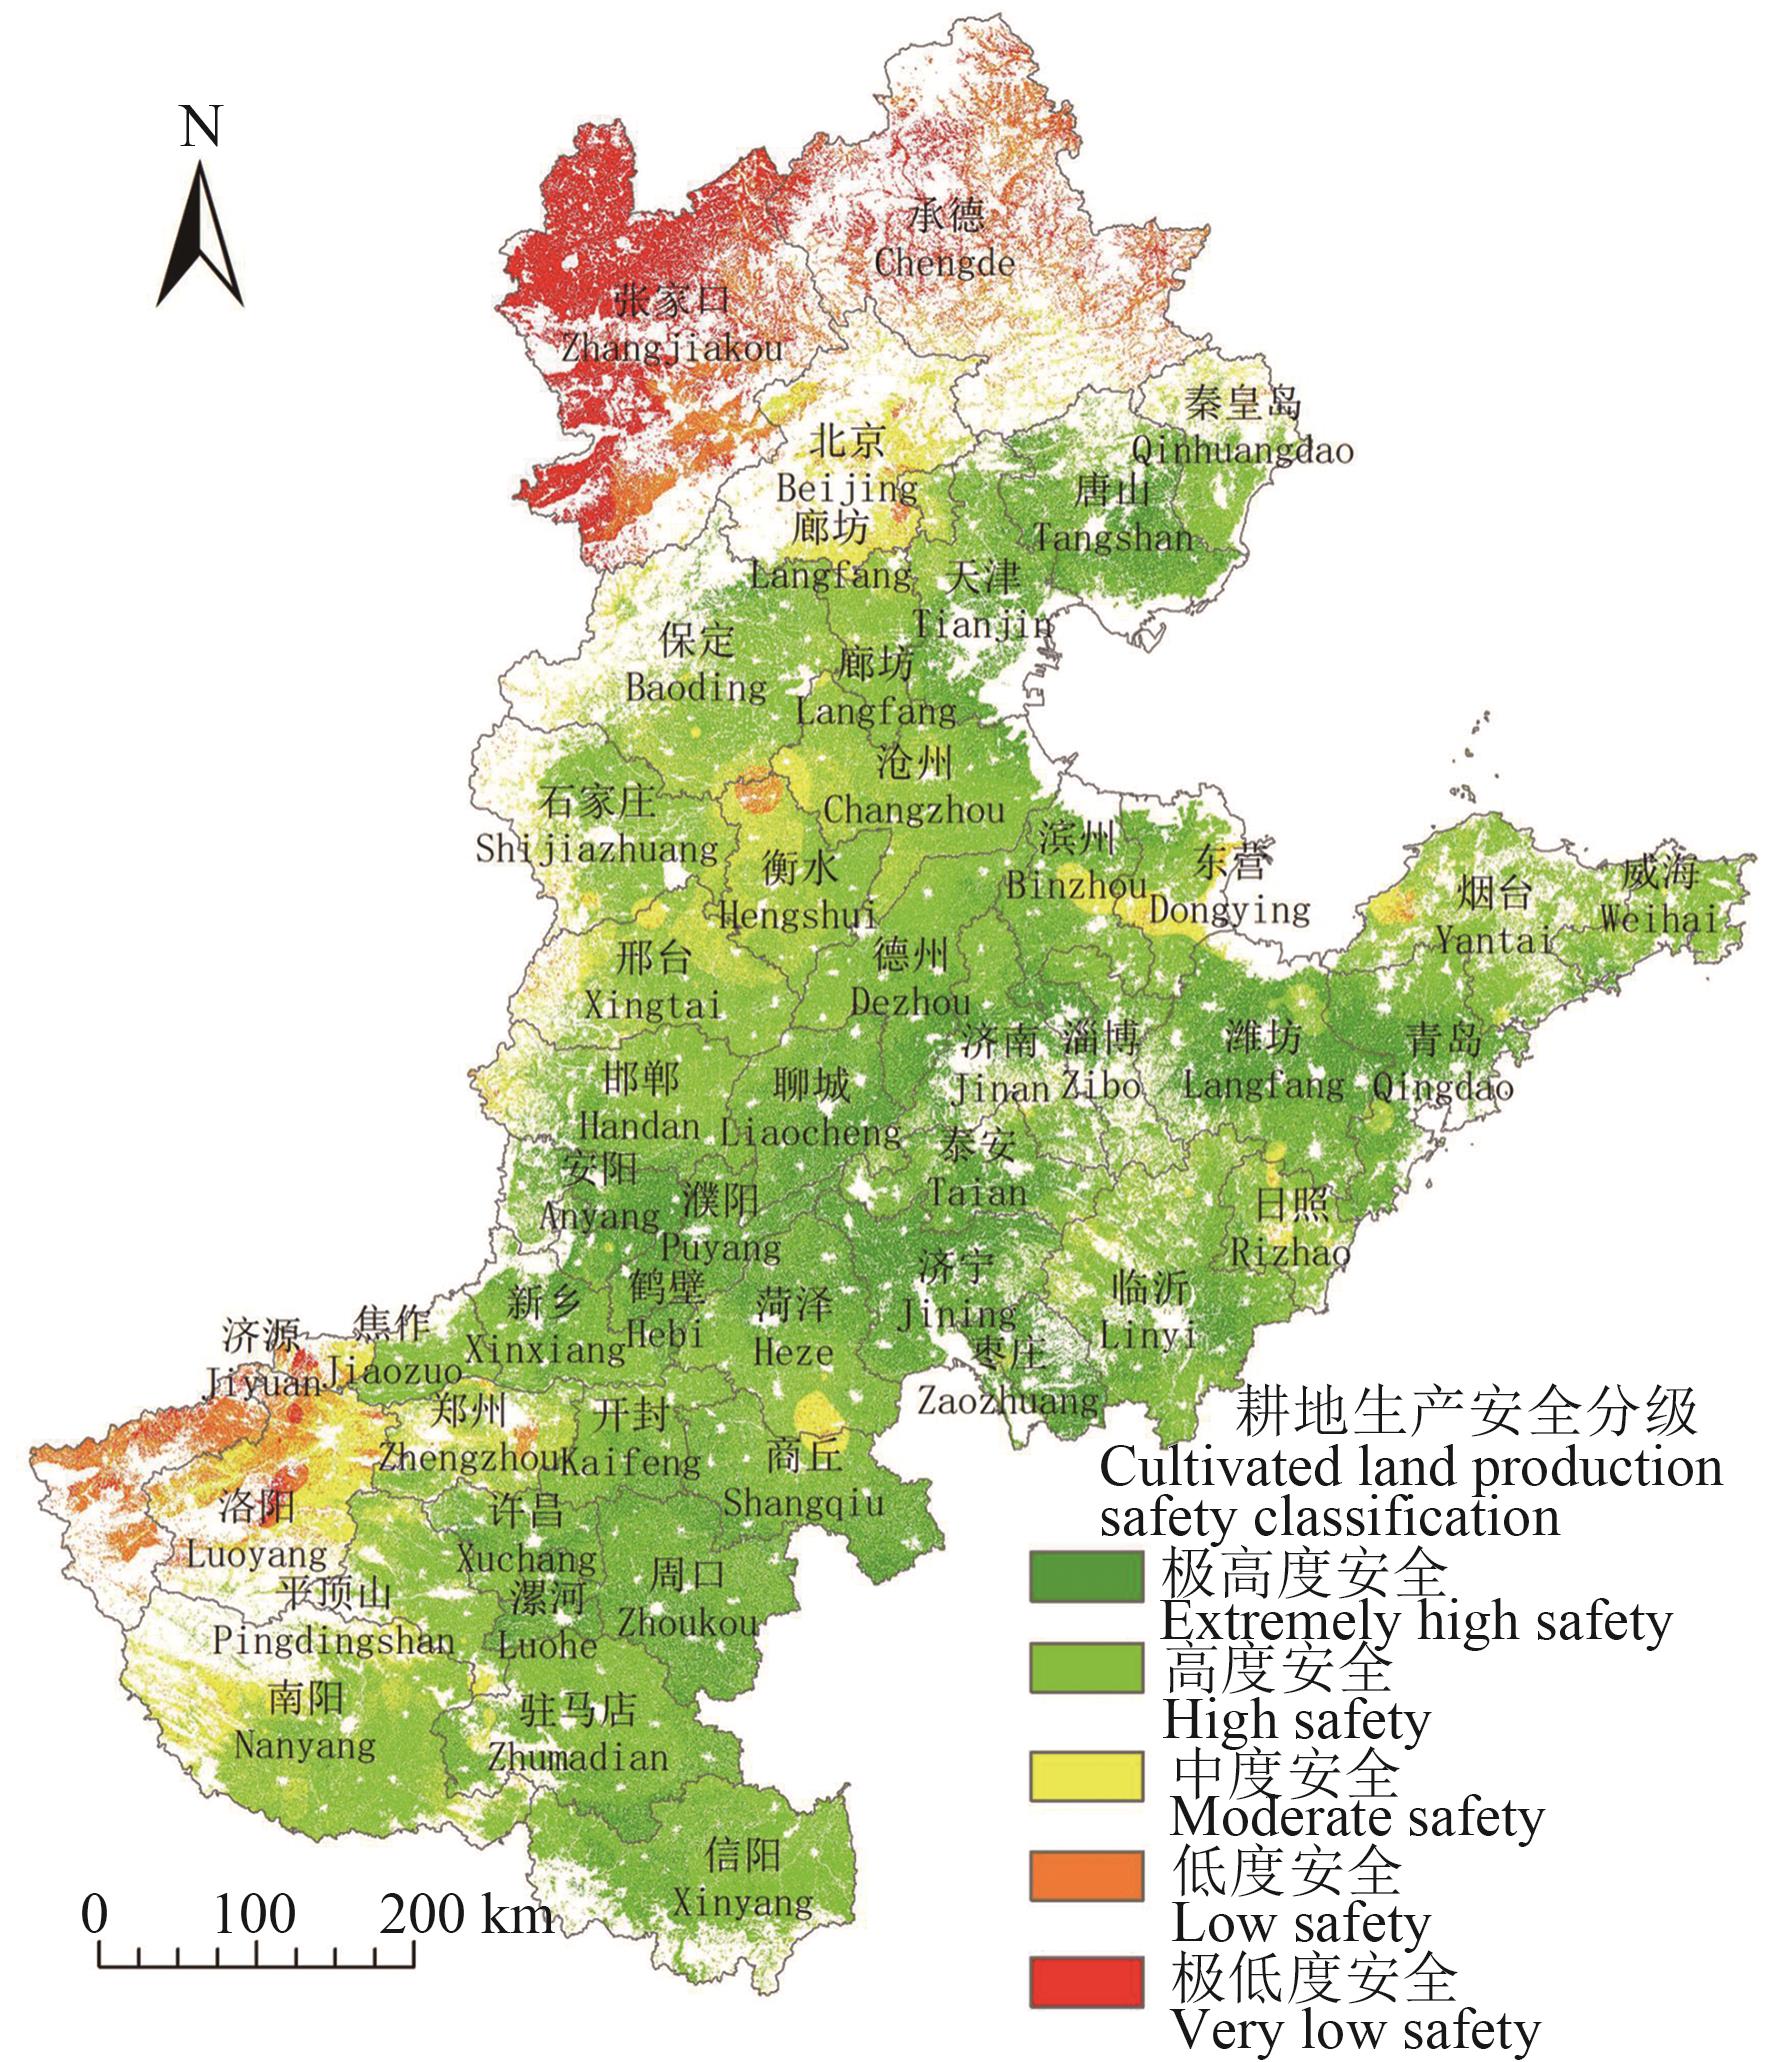
Fig. 3 Distribution of cropland production safety grades in north China plainNote:The map is based on the standard map of GS(2019)1822 downloaded from the standard map service website of the Map Technology Review Center of the Ministry of Natural Resources, and the base map is not modified.
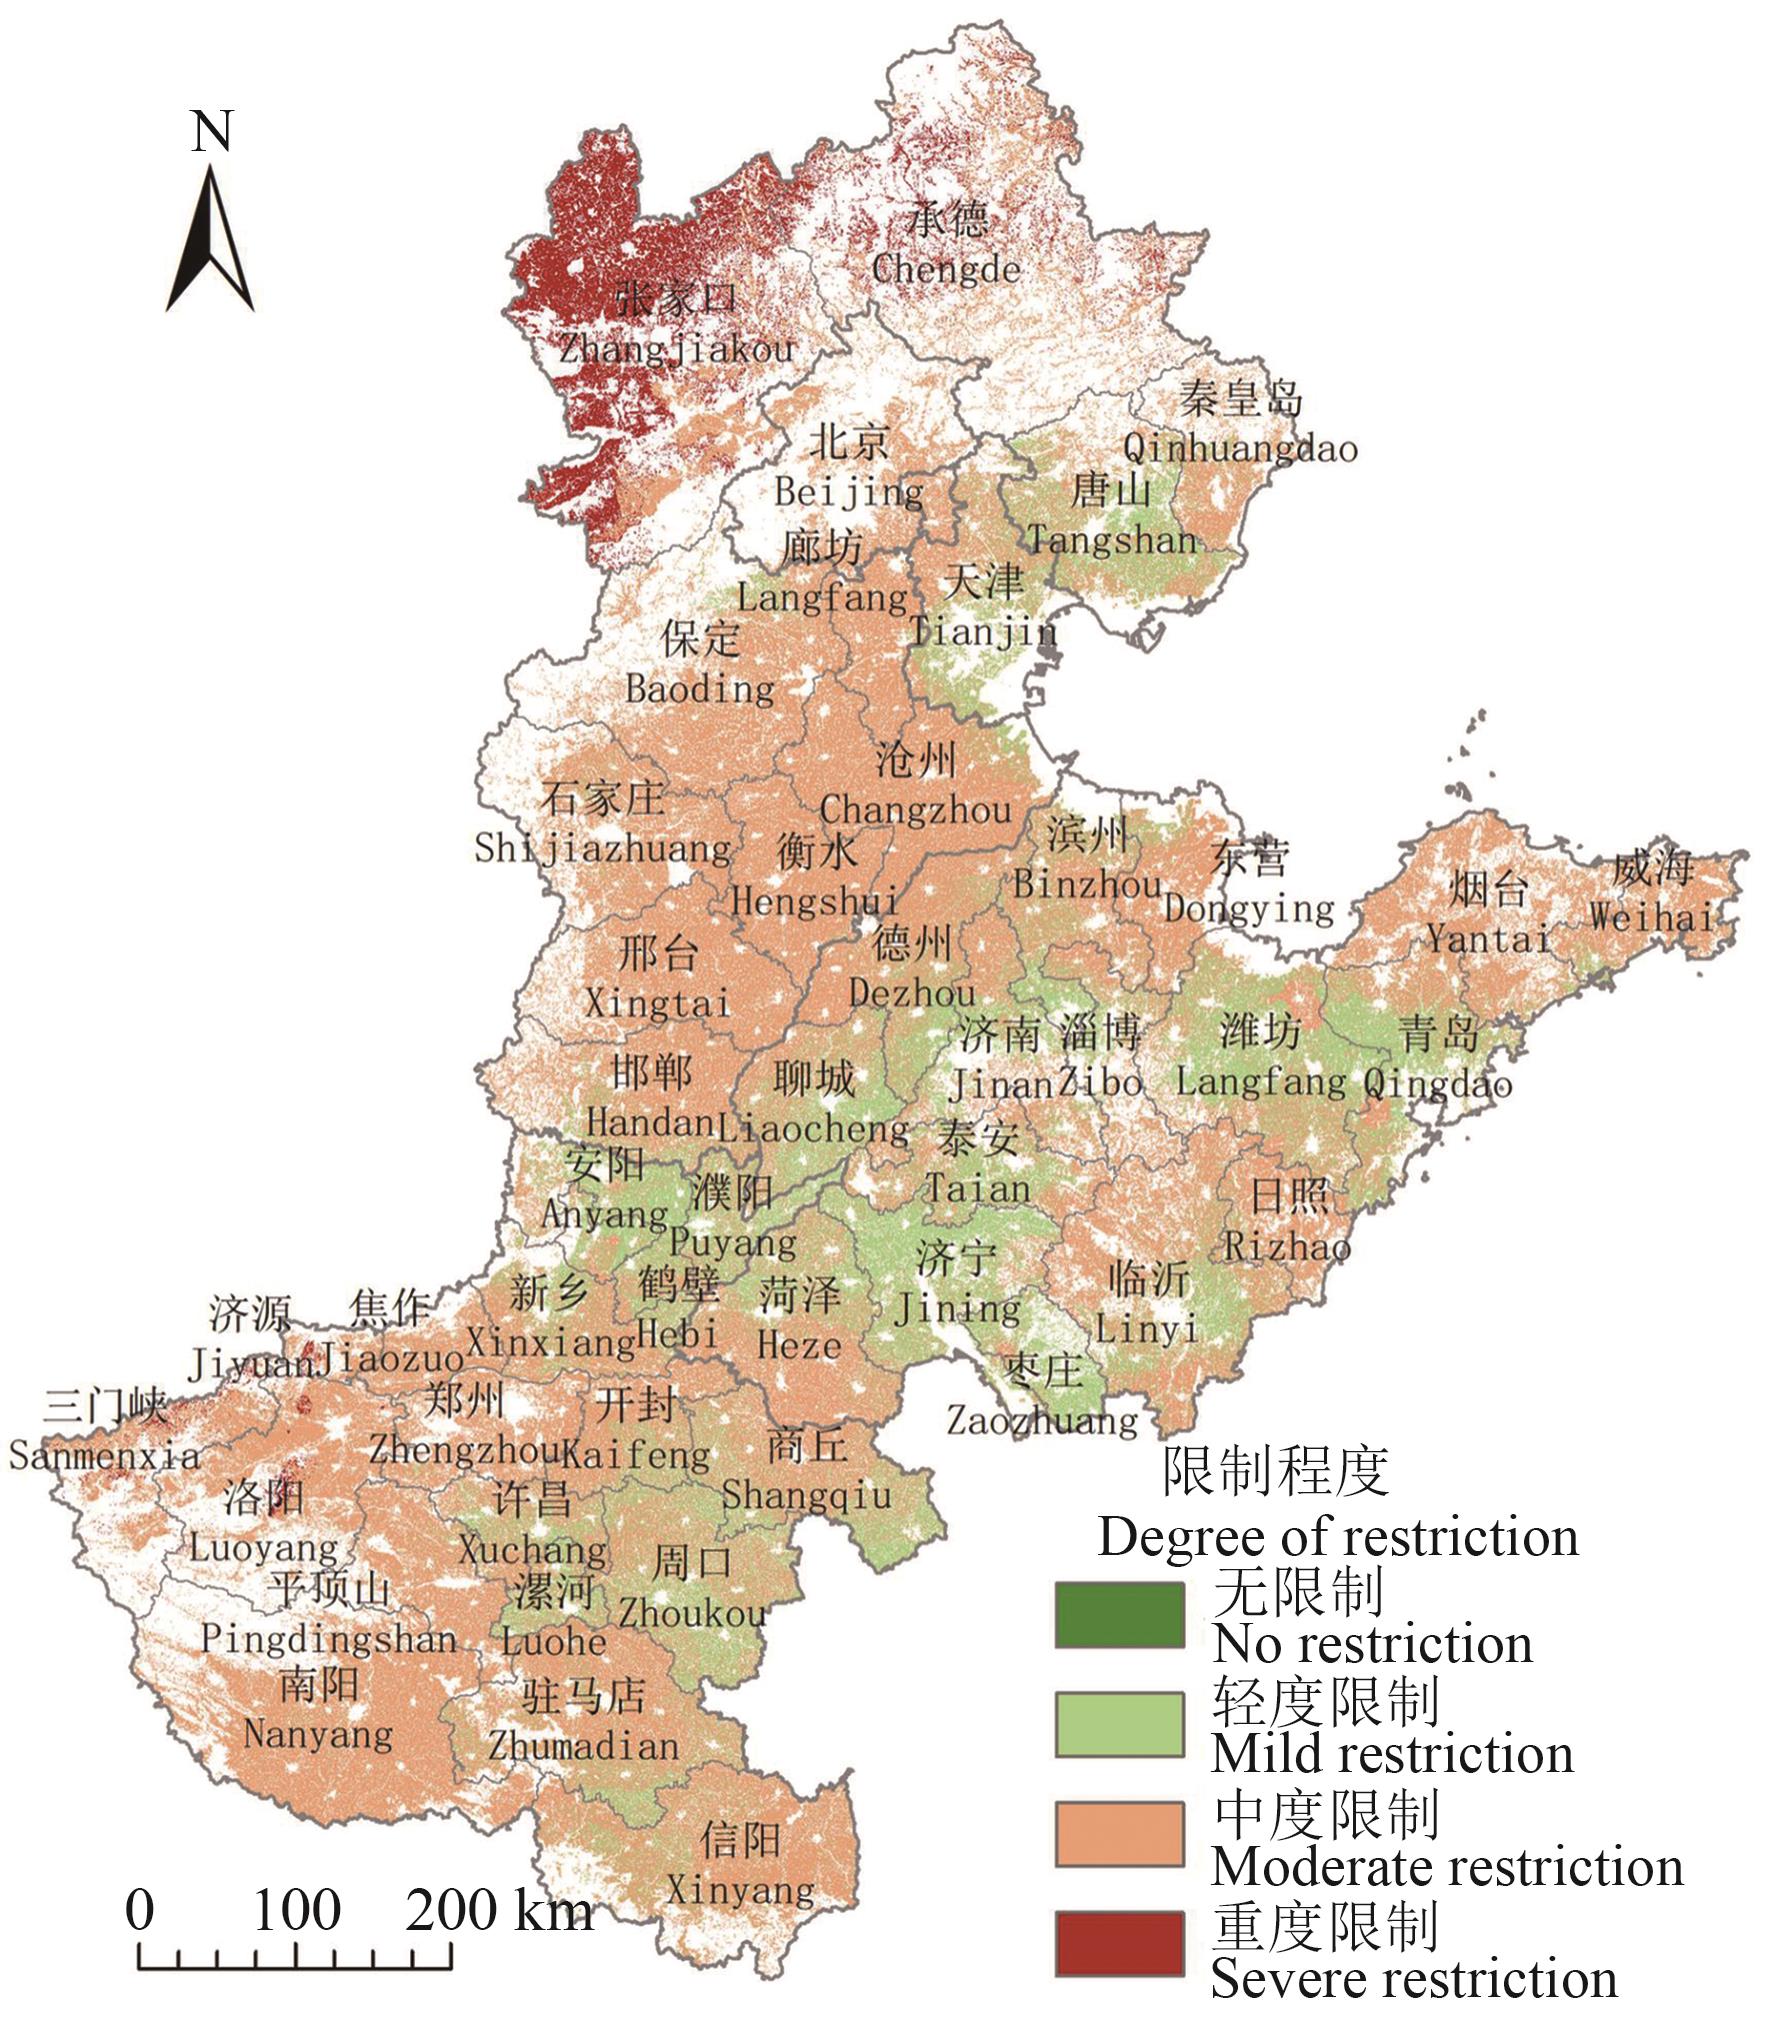
Fig. 4 Distribution of comprehensive limitation degrees of cropland production safety in north China plainNote:The map is based on the standard map of GS(2019)1822 downloaded from the standard map service website of the Map Technology Review Center of the Ministry of Natural Resources, and the base map is not modified.
类型 Type | 指标 Index | 北京 Beijing | 天津 Tianjin | 河北 Hebei | 山东 Shandong | 河南 Henan | 总计 Total |
|---|---|---|---|---|---|---|---|
无限制 Unlimited | 面积Area/hm2 | 0.00 | 0.54 | 8 245.24 | 12 474.40 | 15 499.78 | 36 219.97 |
| 占比Percentage/% | 0.00 | 0.00 | 0.03 | 0.04 | 0.05 | 0.12 | |
轻度限制 Mild restriction | 面积Area/hm2 | 4.77 | 249 877.93 | 653 570.37 | 3 797 871.97 | 2 386 778.24 | 7 088 103.28 |
| 占比Percentage/% | 0.00 | 0.82 | 2.14 | 12.42 | 7.81 | 23.19 | |
中度限制 Moderate restriction | 面积Area/hm2 | 374 958.10 | 346 395.53 | 6 791 130.23 | 6 319 315.51 | 7 939 244.07 | 21 771 043.44 |
| 占比Percentage/% | 1.23 | 1.13 | 22.22 | 20.67 | 25.97 | 71.22 | |
重度限制 Severe restriction | 面积Area/hm2 | 810.29 | 0.00 | 1 611 763.62 | 0.45 | 59 919.89 | 1 672 494.26 |
| 占比Percentage/% | 0.00 | 0.00 | 5.27 | 0.00 | 0.20 | 5.47 |
Table 5 Comprehensive limitation degrees of cropland production safety in different provinces
类型 Type | 指标 Index | 北京 Beijing | 天津 Tianjin | 河北 Hebei | 山东 Shandong | 河南 Henan | 总计 Total |
|---|---|---|---|---|---|---|---|
无限制 Unlimited | 面积Area/hm2 | 0.00 | 0.54 | 8 245.24 | 12 474.40 | 15 499.78 | 36 219.97 |
| 占比Percentage/% | 0.00 | 0.00 | 0.03 | 0.04 | 0.05 | 0.12 | |
轻度限制 Mild restriction | 面积Area/hm2 | 4.77 | 249 877.93 | 653 570.37 | 3 797 871.97 | 2 386 778.24 | 7 088 103.28 |
| 占比Percentage/% | 0.00 | 0.82 | 2.14 | 12.42 | 7.81 | 23.19 | |
中度限制 Moderate restriction | 面积Area/hm2 | 374 958.10 | 346 395.53 | 6 791 130.23 | 6 319 315.51 | 7 939 244.07 | 21 771 043.44 |
| 占比Percentage/% | 1.23 | 1.13 | 22.22 | 20.67 | 25.97 | 71.22 | |
重度限制 Severe restriction | 面积Area/hm2 | 810.29 | 0.00 | 1 611 763.62 | 0.45 | 59 919.89 | 1 672 494.26 |
| 占比Percentage/% | 0.00 | 0.00 | 5.27 | 0.00 | 0.20 | 5.47 |
类型 Type | 指标 Index | 北京 Beijing | 天津 Tianjin | 河北 Hebei | 山东 Shandong | 河南 Henan | 总计 Total |
|---|---|---|---|---|---|---|---|
持续提升区 Continuous improvement zone | 面积 Area/hm2 | 15 434.04 | 578 309.01 | 1 436 440.48 | 89 30 160.59 | 4 143 174.99 | 15 103 519.12 |
占比 Percentage/% | 0.05 | 1.89 | 4.70 | 29.21 | 13.55 | 49.42 | |
重点提升区 Key improvement zone | 面积 Area/hm2 | 35 3126.49 | 11 944.17 | 2 034 370.45 | 5760 19.21 | 1 729 081.01 | 4 704 541.33 |
占比 Percentage/% | 1.16 | 0.04 | 6.66 | 1.88 | 5.66 | 15.39 | |
保护提升区 Protective improvement zone | 面积 Area/hm2 | 14.57 | 18.15 | 3 881 956.61 | 525 248.92 | 4 351 909.44 | 8 759 147.69 |
占比 Percentage/% | 0.00 | 0.00 | 12.70 | 1.72 | 14.24 | 28.65 | |
限制提升区 Restricted improvement zone | 面积 Area/hm2 | 7 169.82 | 6 129.85 | 1 711 861.94 | 98 226.84 | 177 264.36 | 2 000 652.81 |
占比 Percentage/% | 0.02 | 0.02 | 5.60 | 0.32 | 0.58 | 6.54 |
Table 6 Improvement zones for cropland potential production in different provinces
类型 Type | 指标 Index | 北京 Beijing | 天津 Tianjin | 河北 Hebei | 山东 Shandong | 河南 Henan | 总计 Total |
|---|---|---|---|---|---|---|---|
持续提升区 Continuous improvement zone | 面积 Area/hm2 | 15 434.04 | 578 309.01 | 1 436 440.48 | 89 30 160.59 | 4 143 174.99 | 15 103 519.12 |
占比 Percentage/% | 0.05 | 1.89 | 4.70 | 29.21 | 13.55 | 49.42 | |
重点提升区 Key improvement zone | 面积 Area/hm2 | 35 3126.49 | 11 944.17 | 2 034 370.45 | 5760 19.21 | 1 729 081.01 | 4 704 541.33 |
占比 Percentage/% | 1.16 | 0.04 | 6.66 | 1.88 | 5.66 | 15.39 | |
保护提升区 Protective improvement zone | 面积 Area/hm2 | 14.57 | 18.15 | 3 881 956.61 | 525 248.92 | 4 351 909.44 | 8 759 147.69 |
占比 Percentage/% | 0.00 | 0.00 | 12.70 | 1.72 | 14.24 | 28.65 | |
限制提升区 Restricted improvement zone | 面积 Area/hm2 | 7 169.82 | 6 129.85 | 1 711 861.94 | 98 226.84 | 177 264.36 | 2 000 652.81 |
占比 Percentage/% | 0.02 | 0.02 | 5.60 | 0.32 | 0.58 | 6.54 |
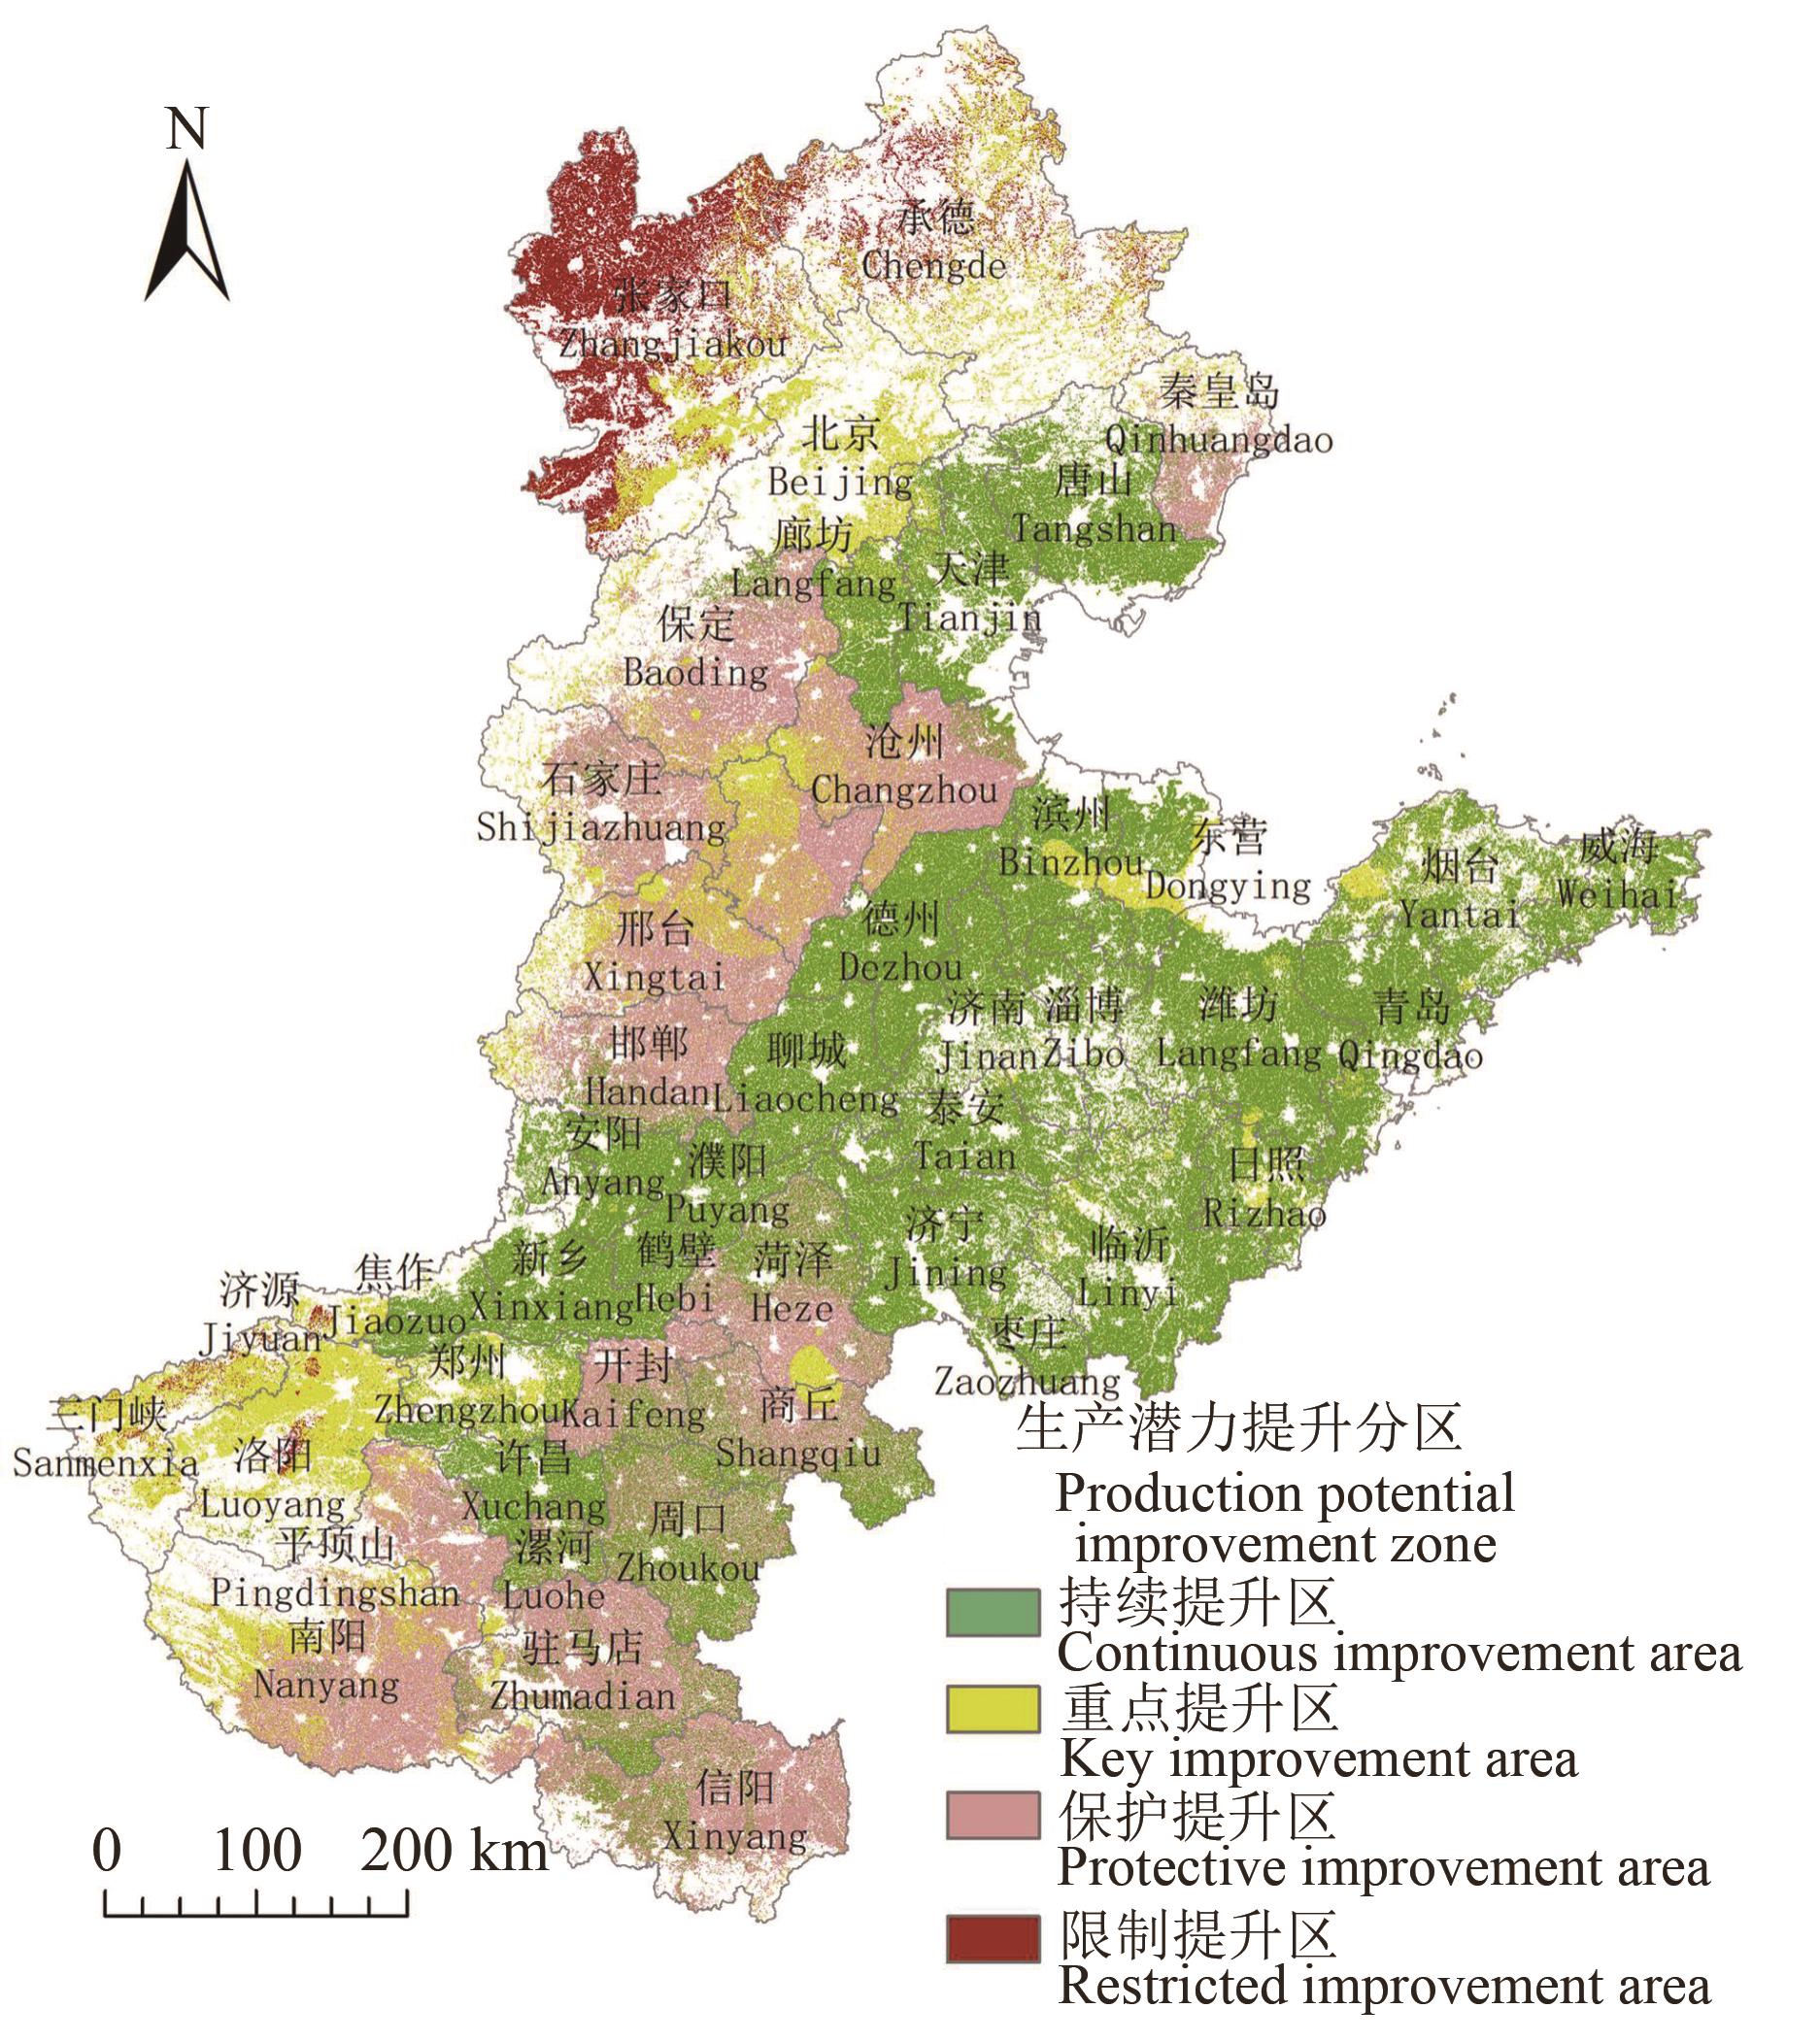
Fig. 6 Improvement zones for cropland potential production in north China plainNote:The map is based on the standard map of GS(2019)1822 downloaded from the standard map service website of the Map Technology Review Center of the Ministry of Natural Resources, and the base map is not modified.
| [1] | 冀咏赞,闫慧敏,刘纪远,等.基于MODIS数据的中国耕地高中低产田空间分布格局[J].地理学报,2015,70(5):766-778. |
| JI Y Z, YAN H M, LIU J Y, et al.. A MODIS data derived spatial distribution of high-,medium- and low-yield cropland in China [J]. Acta Geogr. Sin., 2015, 70(5): 766-778. | |
| [2] | 郧文聚,吴克宁,张小丹.中国耕地健康问题及防治对策[J].中国发展,2019,19(4):34-37. |
| YUN W J, WU K N, ZHANG X D. Health problems and prevention countermeasures of cultivated land in China [J].China Dev., 2019, 19(4): 34-37. | |
| [3] | 徐明岗,卢昌艾,张文菊,等.我国耕地质量状况与提升对策[J].中国农业资源与区划,2016,37(7):8-14. |
| XU M G, LU C A, ZHANG W J, et al.. Situation of the quality of arable land in China and improvement strategy [J].Chin. J.Agric. Resour. Reg. Plan., 2016, 37(7): 8-14. | |
| [4] | 陈印军,肖碧林,方琳娜,等.中国耕地质量状况分析[J].中国农业科学,2011,44(17):3557-3564. |
| CHEN Y J, XIAO B L, FANG L N, et al.. The quality analysis of cultivated land in China [J]. Sci. Agric. Sin., 2011, 44(17): 3557-3564. | |
| [5] | 孔祥斌,李翠珍,赵晶,等.乡镇尺度耕地生产能力实现程度分析与实证[J].农业工程学报,2010,26(12):345-351. |
| KONG X B, LI C Z, ZHAO J, et al.. Method and empirical research on the realization degree of arable land production capacity at town level [J].Trans. Chin. Soc.Agric. Eng., 2010, 26(12): 345-351. | |
| [6] | 张新乐,钱蕾,鲍依临,等.黑土区田块尺度耕地质量遥感监测与评价[J].土壤通报,2020,51(6):1303-1312. |
| ZHANG X L, QIAN L, BAO Y L, et al.. Monitoring and evaluation of cultivated land quality with remote sensing at a field scale in the black soil area [J]. Chin. J. Soil Sci., 2020, 51(6): 1303-1312. | |
| [7] | ACTON D F, GREGORICH L J. Executive summary of the health of our soils toward sustainable agriculture in Canada [C]∥Research Branch: Centre for Land and Biological Resources Research, Agriculture and Agri-Food Canada. Ottawa, Canada, 1996. |
| [8] | ROPER W R, OSMOND D L, HEITMAN J L, et al.. Soil health indicators do not differentiate among agronomic management systems in north Carolina soils [J]. Soil Sci. Soc. Am. J., 2017, 81(4): 828-843. |
| [9] | DORAN J W, COLEMAN D C, BEZDICEK D F. Defining Soil Quality for a Sustainable Environment [M]. Minneapolis, Minnesota, 1994:1-368. |
| [10] | MAUSEL P W. Soil quality in illiois-an example of a soils geography resource analysis [J]. Profess. Geogr., 1971, 23(2):127-136. |
| [11] | DAVID R. What constitutes ecosystem health? [J] Perspect. Biol. Med., 1989, 33(1):120-132. |
| [12] | CAIRNS J. Ecosystem health through ecological restoration:barriers and opportunities [J]. J. Aquat. Ecosyst. Health,1994, 3(1):5-14. |
| [13] | SCHAEFFER D J, HERRICKS E E, KERSTER H W. Ecosystem health:I.measuring ecosystem health [J].Environ.Manage.,1988, 12(4): 445-455. |
| [14] | 高涵,陈伟强,郧文聚,等.东北典型平原区耕地健康产能评价与验证:以吉林省大安市为例[J].土壤通报,2020,51(4):784-794. |
| GAO H, CHEN W Q, YUN W J, et al.. Evaluation and verification of healthy productivity of cultivated land in the typical plain area of Northeast China: a case study of Da’an city, Jilin province [J]. Chin. J. Soil Sci., 2020, 51(4): 784-794. | |
| [15] | 高璐璐,张超,吕雅慧,等.耕地健康产能多要素评价体系构建与应用[J].农业机械学报,2020,51(5):215-222. |
| GAO L L, ZHANG C, LYU Y H, et al.. Construction and application of multi-factor cultivated land health productivity evaluation system [J]. Trans.Chin.Soc.Agric.Mach., 2020, 51(5): 215-222. | |
| [16] | 张小丹,吴克宁,杨淇钧,等.耕地健康产能内涵及评价指标体系研究进展[J].土壤通报,2020,51(1):245-252. |
| ZHANG X D, WU K N, YANG Q J, et al.. Progress on connotation and evaluation index system of cultivated land healthy productivity [J]. Chin. J. Soil Sci., 2020, 51(1): 245-252. | |
| [17] | 胡存智.中国农用土地分等定级理论与方法研究:兼论《农用地分等规程》总体思路及技术方案设计[J].中国土地科学,2012,26(3):4-13. |
| HU C Z. Theory and method of China’s agricultural land classification and gradation:on general framework and technical scheme of the agricultural land classification rules [J]. China Land Sci., 2012, 26(3): 4-13. | |
| [18] | 安萍莉,陈思宇,孟丽君,等.三调耕地分等中全国标准耕作制度体系的确定[J].中国农业大学学报,2020,25(8):61-72. |
| AN P L, CHEN S Y, MENG L J, et al..Determination of standard farming system in cultivated land classification of the third national land survey [J]. J.China Agric. Univ., 2020, 25(8): 61-72. | |
| [19] | 余晨,罗斌,王大国,等.基于改进FAHP-Entropy赋权法的丘区耕地整理潜力评价[J].中国农业资源与区划,2020,41(6):15-24. |
| YU C, LUO B, WANG D G, et al.. Evaluation of cultivated land consolidation potential used by improved fahp-entropy in hilly area [J]. Chin.J.Agric. Resour. Reg.Plan., 2020, 41(6): 15-24. | |
| [20] | 陈亚恒,刘会玲,张俊梅,等.农用地分等成果在耕地整理潜力计算中的应用[J].农业工程学报,2008,24(增1):177-180. |
| CHEN Y H, LIU H L, ZHANG J M, et al.. Application of agricultural land classification in cultivated land consolidation potential predicting [J]. Trans. Chin. Soc. Agric. Eng., 2008, 24(S1): 177-180. | |
| [21] | 杨建宇, 杜贞容, 杜振博, 等.基于耕地质量评价和局部空间自相关的高标准农田划定[J].农业机械学报,2017,48(6):109-115. |
| YANG J Y, DU Z R, DU Z B, et al.. Well-facilitied capital farmland assignment based on land quality evaluation and LISA [J]. Trans. Chin. Soc. Agric. Mach., 2017, 48(6): 109-115. | |
| [22] | 麻馨月,杨洋,娄成武.21世纪以来环渤海地区耕地生产潜力时空动态[J].中国人口·资源与环境,2016,26(增1):226-231. |
| MA X Y, YANG Y, LOU C W. Spatiotemporal dynamics of cultivated land potential productivity in bohai rim since the 21st century [J]. China Popul. Resour. Environ., 2016, 26(S1): 226-231. | |
| [23] | BUCKLEYJ J, FEURING T, HAYASHI Y. Fuzzy hierarchical analysis[C]∥Society for Risk Analysis Annual Meeting. Knoxville, TN, 1948: 1009-1013. |
| [24] | 项晓敏,金晓斌,杜心栋,等.基于Ward系统聚类的中国农用地整治实施状况分析[J].农业工程学报,2015,31(6):257-265. |
| XIANG X M, JIN X B, DU X D, et al.. Analysis of farmland consolidation implementation status in China based on ward hierarchical clustering [J]. Trans. Chin. Soc. Agric. Eng., 2015, 31(6): 257-265. | |
| [25] | 孙瑞,金晓斌,赵庆利,等.集成 “质量-格局-功能” 的中国耕地整治潜力综合分区[J].农业工程学报,2020,36(7):264-275. |
| SUN R, JIN X B, ZHAO Q L, et al.. Comprehensive zoning of cultivated land consolidation potential integrating “quality-pattern-function” in China [J]. Trans.Chin.Soc.Agric.Eng., 2020, 36(7): 264-275. | |
| [26] | 江志猛,陈文波,郑蕉.基于SOFM神经网络的土地整治时空配置分区研究[J].中国土地科学,2019,33(11):89-97, 104. |
| JIANG Z M, CHEN W B, ZHENG J. Study on temporal-spatial allocation zoning of land reclamation based on SOFM neural network [J]. China Land Sci., 2019, 33(11): 89-97, 104. | |
| [27] | 熊昌盛,张永蕾,王雅娟,等.中国耕地多功能评价及分区管控[J].中国土地科学,2021,35(10):104-114. |
| XIONG C S, ZHANG Y L, WANG Y J, et al.. Multi-function evaluation and zoning control of cultivated land in China [J].China Land Sci., 2021, 35(10): 104-114. | |
| [28] | BEZA E, SILVA J V, KOOISTRA L, et al.. Review of yield gap explaining factors and opportunities for alternative data collection approaches [J]. Eur. J. Agron., 2017, 82: 206-222. |
| [29] | BAGHERZADEH A, MANSOURI DANESHVAR M R. Physical land suitability evaluation for specific cereal crops using GIS at Mashhad Plain,Northeast of Iran [J].Front. Agric. China, 2011, 5(4): 504-513. |
| [30] | BEINROTH F H, JONES J W, KNAPP E B. Evaluation of land resources using crop models and a GIS [J]. Understanding Options Agric. Prod., 1998(7): 293-311. |
| [31] | SESHAGIRI RAO K V, GAWANDE S P, BALI Y P. Evaluation of land resources by different technig for their proper utilization [J]. J.Indian Soc.Photo Interpret. Remote. Sens., 1985, 13(1): 17-28. |
| [32] | 孙妍芳,裴久渤,张立江,等.辽宁棕壤耕地质量评价及障碍因素类型分区研究[J].中国农业资源与区划,2017,38(11):130-137, 144. |
| SUN Y F, PEI J B, ZHANG L J, et al.. Assessment of cultivated land quality and obstacle factors zoning of brown earth:a case study of Liaoning province [J]. Chin.J.Agric.Resour. Reg. Plan., 2017, 38(11): 130-137, 144. | |
| [33] | 龙怀玉,雷秋良.中国土系志河北卷[M].北京:科学出版社,2017:1-415. |
| [34] | 吴克宁,李玲,鞠兵,等.中国土系志河南卷[M].北京:科学出版社,2019:1-450. |
| [35] | 赵玉国,宋付朋.中国土系志山东卷[M].北京:科学出版社,2019:1-312. |
| [36] | 张凤荣,刘黎明,王秀丽,等.中国土系志北京天津卷[M].北京:科学出版社,2017:1-368. |
| [37] | 周健民,沈仁芳.土壤学大辞典[M].北京:科学出版社,2013:1-298. |
| [38] | 李强,文唤成,胡彩荣.土壤pH值的测定国际国内方法差异研究[J].土壤,2007,39(3):488-491. |
| LI Q, WEN H C, HU C R. Difference between international and domestic methods in determining soil pH [J]. Soils, 2007, 39(3):488-491. | |
| [39] | 鲍士旦.土壤农化分析[M].第3版.北京:中国农业出版社,2000:1-495. |
| [40] | 中华人民共和国环境保护部. 土壤质量 全氮的测定 凯氏法: [S].北京:中国环境科学出版社,2014. |
| [41] | 孟庆香,张莉坤,郧文聚,等.黄土丘陵区典型县域耕地健康评价:以河南宜阳县为例[J].中国水土保持科学,2021,19(1):11-19. |
| MENG Q X, ZHANG L K, YUN W J, et al.. Health evaluation of cultivated land in typical counties of Loess Hilly region:a case study of Yiyang county, Henan province [J]. Sci. Soil Water Conserv., 2021, 19(1): 11-19. | |
| [42] | 张江周,李奕赞,李颖,等.土壤健康指标体系与评价方法研究进展[J].土壤学报,2022,59(3):603-616. |
| ZHANG J Z, LI Y Z, LI Y, et al.. Advances in the indicator system and evaluation approaches of soil health [J]. Acta Pedol.Sin., 2022, 59(3): 603-616. | |
| [43] | 路欣怡,杨智慧,张璐,等.基于系统协调的集约化农区县域耕地健康评价:以河北省曲周县为例[J].中国农业资源与区划,2022,43(7):60-73. |
| LU X Y, YANG Z H, ZHANG L, et al.. Health evaluation of counties’cultivated land in intensive agricultural regions based on system coordination—a case study of Quzhou county,Hebei province [J]. Chin. J. Agric. Resour. Reg. Plan., 2022, 43(7): 60-73. | |
| [44] | 温良友,张青璞,孔祥斌,等.基于产能与健康综合评价的北京大兴区耕地整治分区[J].农业工程学报,2019,35(22):79-89. |
| WEN L Y, ZHANG Q P, KONG X B, et al.. Arable land consolidation zoning based on comprehensive evaluation of capacity and health [J]. Trans. Chin. Soc. Agric. Eng., 2019, 35(22): 79-89. | |
| [45] | 孙晓兵,孔祥斌,张青璞,等.基于指标综合特征的耕地遗传质量和动态质量评价[J].农业工程学报,2020,36(22):254-265. |
| SUN X B, KONG X B, ZHANG Q P, et al.. Evaluation of inherent quality and dynamic quality of cultivated land based on comprehensive characteristics of indexes [J]. Trans.Chin.Soc. Agric. Eng., 2020, 36(22): 254-265. | |
| [46] | 赵海乐,徐艳,张国梁,等.基于限制因子改良与耕地质量潜力耦合的耕地整治分区[J].农业工程学报,2020,36(21):272-282. |
| ZHAO H L, XU Y, ZHANG G L, et al.. Farmland consolidation zoning based on coupling of improved limiting factors and farmland quality potentiall [J]. Trans.Chin.Soc.Agric.Eng., 2020, 36(21): 272-282. | |
| [47] | 刘光盛,赵乐松,程迎轩,等.基于限制因子的粤北丘陵山区耕地宜机化整治分区[J].农业工程学报,2021,37(12):262-270. |
| LIU G S, ZHAO L S, CHENG Y X, et al.. Land consolidation zoning of northern Guangdong for suitable mechanization transformation in hilly and mountainous areas based on limiting factors [J]. Trans.Chin.Soc.Agric.Eng., 2021, 37(12): 262-270. | |
| [48] | 张金懿,郝晋珉,王楠,等.山东省耕地质量空间自相关分析与耕地保护分区研究[J].土壤通报,2023,54(4):757-767. |
| ZHANG J Y, HAO J M, WANG N, et al.. Protection zoning of cultivated land based on spatial autocorrelation in Shandong province [J]. Chin. J. Soil Sci., 2023, 54(4): 757-767. | |
| [49] | 杨颖,郭志英,潘恺,等.基于生态系统多功能性的农田土壤健康评价[J].土壤学报,2022,59(2):461-475. |
| YANG Y, GUO Z Y, PAN K, et al.. Farmland soil health assessment based on ecosystem multi-functionality [J].Acta Pedol. Sin., 2022, 59(2): 461-475. | |
| [50] | 王策. 基于可持续发展需求的山区耕地产能评价研究[D].保定:河北农业大学,2021. |
| WANG C. Study on productivity evaluation of cultivated land in mountainous area based on sustainable development demand [D]. Baoding: Hebei Agricultural University, 2021. |
| [1] | ZHAO Ningbo, YANG Jiajia, ZHAO Yingjun, QIN Kai, YANG Yuechao, LI Ming. Comprehensive Evaluation of Black Soil Quality Based on Aerial Hyperspectral Inversion [J]. Journal of Agricultural Science and Technology, 2021, 23(11): 88-98. |
| [2] | ZHANG Kai, ZENG Zhao-hai*, ZHAO Jie, WANG Xi-quan, ZHOU Jie, XU He-shui, WANG Zhi-min. Impact Analysis of Reduce the Extraction of Groundwater on Wheat Production in North China Plain [J]. Journal of Agricultural Science and Technology, 2016, 18(5): 111-117. |
| [3] | GUO Yan\|zhi, WANG Xiao\|hu*, SUN Jun\|mao. The Estimation of Saving Water Resources Because of Substitute Planting of Potato Instead Winter Wheat in the Funnel Area of the North China Plain [J]. , 2014, 16(6): 159-163. |
| [4] | ZHANG Er\|peng| ZHAO Xin| WEI Yan\|hua| CHEN Fu| ZHANG Hai\|lin*. Farmers Perception and Problems of Conservation Tillage Extension [J]. , 2014, 16(2): 166-173. |
| [5] | LU Jian-zhong1, LI Si-jing2. Studies on Evaluation Index System of Independent Innovation Capability for Agricultural Research Institutions [J]. , 2011, 13(4): 1-6. |
| Viewed | ||||||
|
Full text |
|
|||||
|
Abstract |
|
|||||
 京公网安备11010802021197号