


中国农业科技导报 ›› 2023, Vol. 25 ›› Issue (4): 132-146.DOI: 10.13304/j.nykjdb.2022.1068
柯昊纯( ), 李琨(), 程瑞锋()
收稿日期:2022-12-07
接受日期:2023-02-13
出版日期:2023-04-01
发布日期:2023-06-26
通讯作者:
李琨,程瑞锋
作者简介:柯昊纯 E-mail:kehaochun@caas.cn
基金资助:
Haochun KE(), Kun LI(), Ruifeng CHENG()
Received:2022-12-07
Accepted:2023-02-13
Online:2023-04-01
Published:2023-06-26
Contact:
Kun LI,Ruifeng CHENG
摘要:
为了研究营养液紫外LED杀菌(ultraviolet LED nutrient solution sterilization, UV-NSS)模组内紫外辐照分布并优化其关键结构参数,采用Tracepro光学仿真软件对UV-NSS模组进行建模和光线追迹,并以模组管道内径、管壁厚度、管灯距离及灯条内表面双向反射分布函数(bidirectional reflectance distribution function, BRDF)为参数因子,以有效紫外辐照比例(effective UV radiation ratio, EURR)和辐照离散度(irradiance dispersion, ID)为响应值进行响应面法参数优化。结果表明,当UV-NSS模组管道内径28 mm、管壁厚度2 mm、管灯距离4 mm、BRDF为0时,其模型EURR为12.14%,ID为0.320 6,模型中心位置紫外辐照度模拟值与实测值仅相差3.68%,可准确反映模组内辐照分布情况。基于上述模型开展中心复合有界设计,以响应面法拟合EURR和ID的二次回归方程,其决定系数分别为0.962 0和0.967 8,拟合显著(P<0.05)。以EURR最大化、ID最小化为目标,结合响应面法与实际情况确定参数因子的最优组合为管道内径50 mm、管壁厚度3 mm、管灯距离0.6 mm、BRDF为0.55。代入模型后EURR为32.11%,较优化前提升了164.50%;ID为0.317 8,较优化前降低了0.87%。采用该参数制造UV-NSS模组,其紫外辐照度实测值与模拟值仅相差1.73%。
中图分类号:
柯昊纯, 李琨, 程瑞锋. 营养液紫外LED杀菌模组仿真与响应面法优化[J]. 中国农业科技导报, 2023, 25(4): 132-146.
Haochun KE, Kun LI, Ruifeng CHENG. Simulation and Optimization on Ultraviolet LED Nutrient Solution Sterilization Module Based on Response Surface Method[J]. Journal of Agricultural Science and Technology, 2023, 25(4): 132-146.
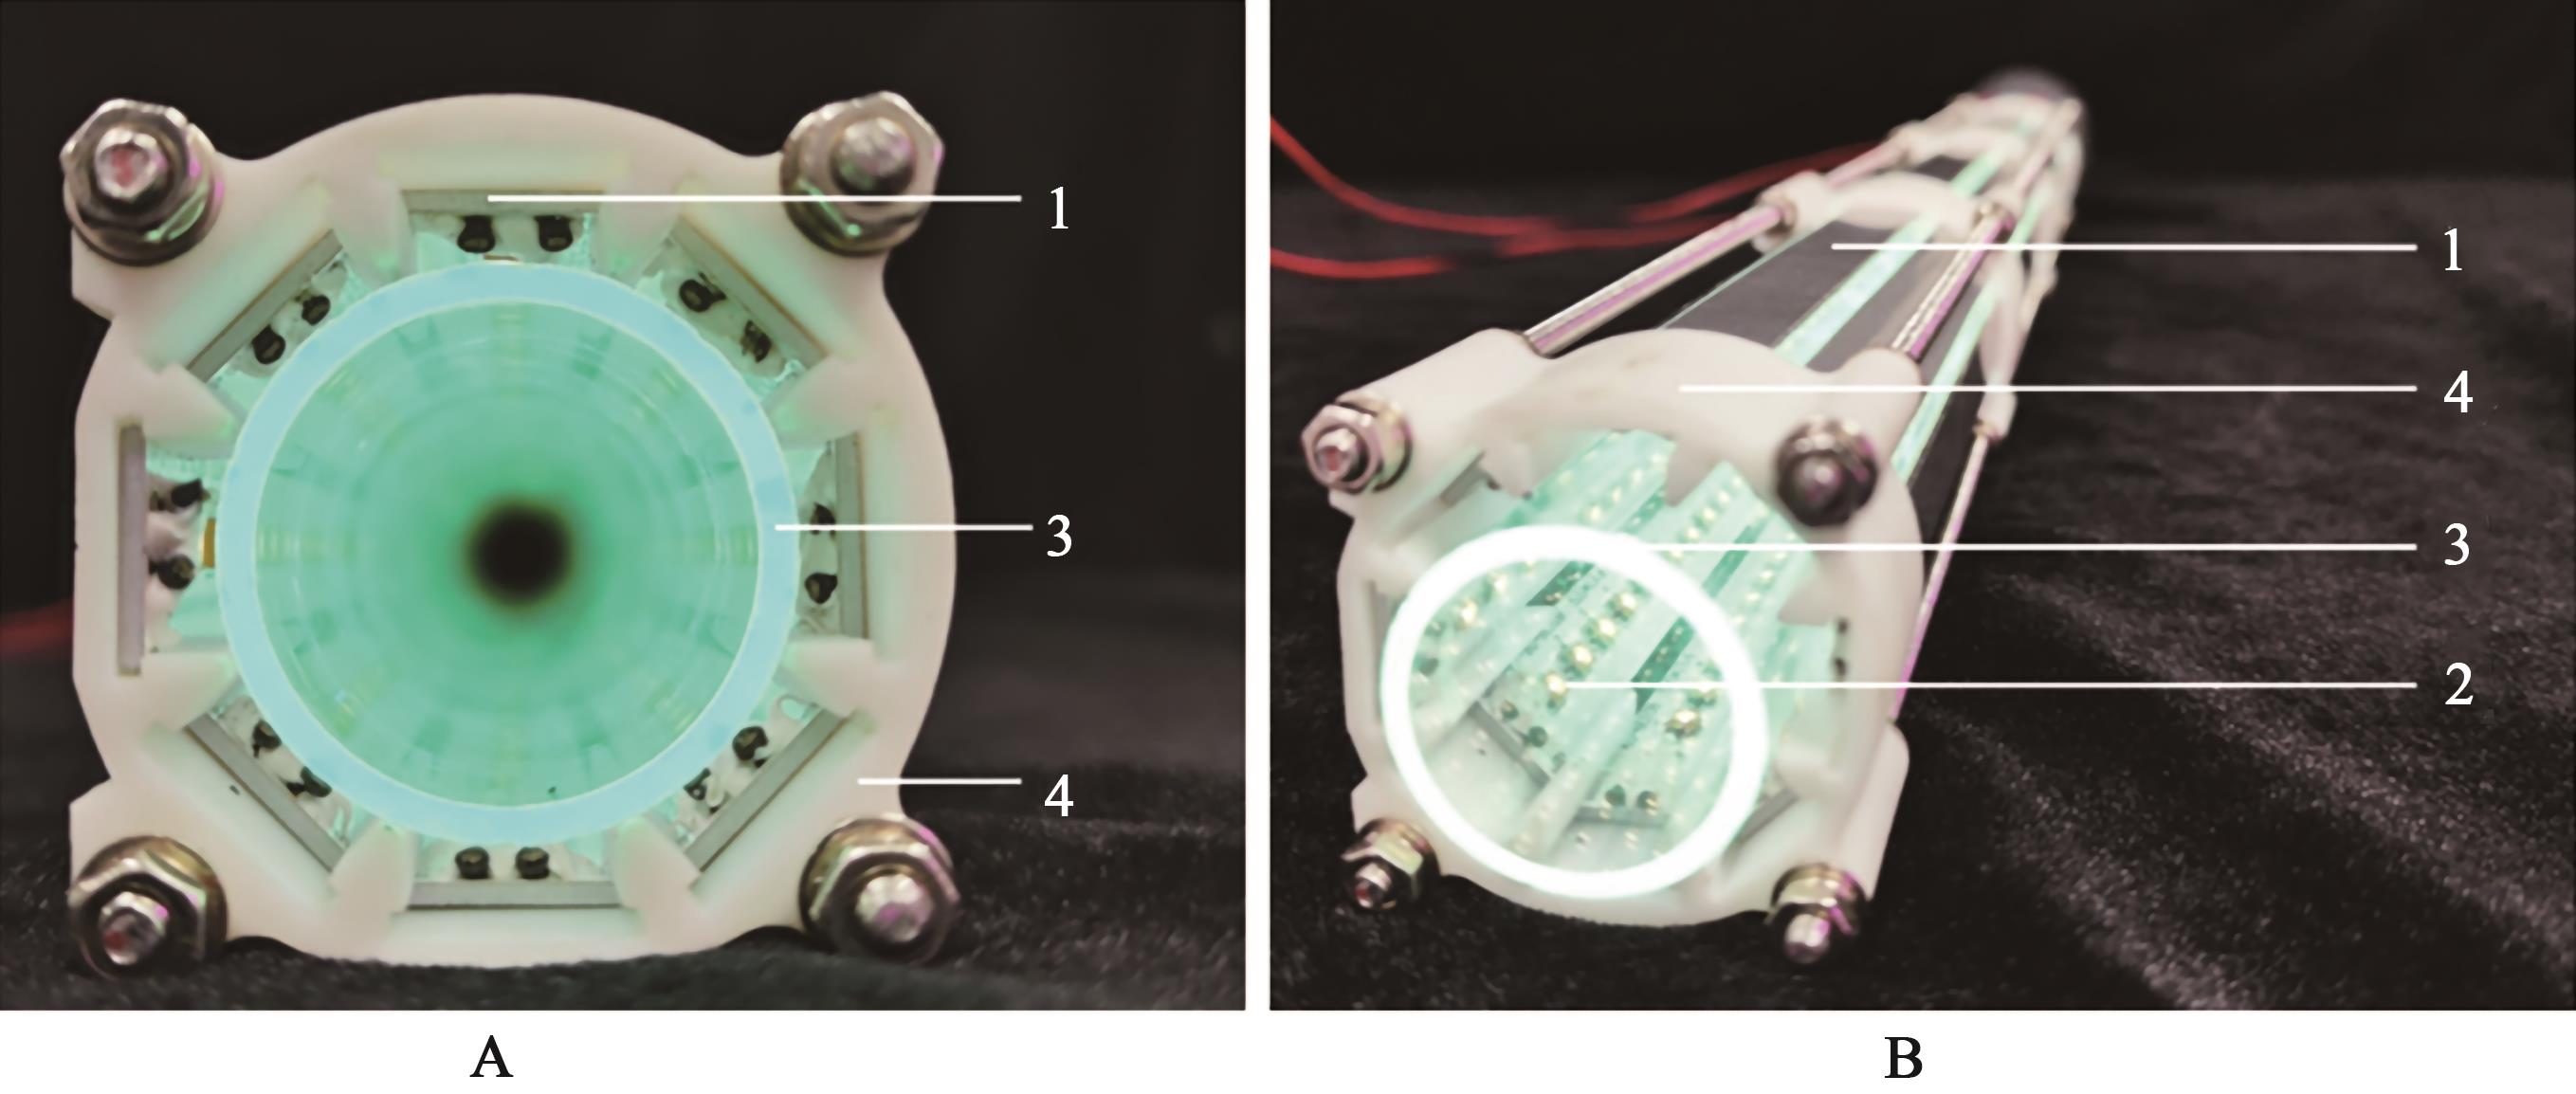
图1 UV-NSS模组A:UV-NSS模组正面;B:UV-NSS模组斜侧面。1—UV-LED灯条;2—UV-LED灯珠;3—石英管;4—固定装置
Fig. 1 Pictures of UV-NSS moduleA:Front of UV-NSS module; B:Oblique side of UV-NSS module. 1—UV-LED bar; 2—UV-LED beads; 3—Quartz tube; 4—Fixtures
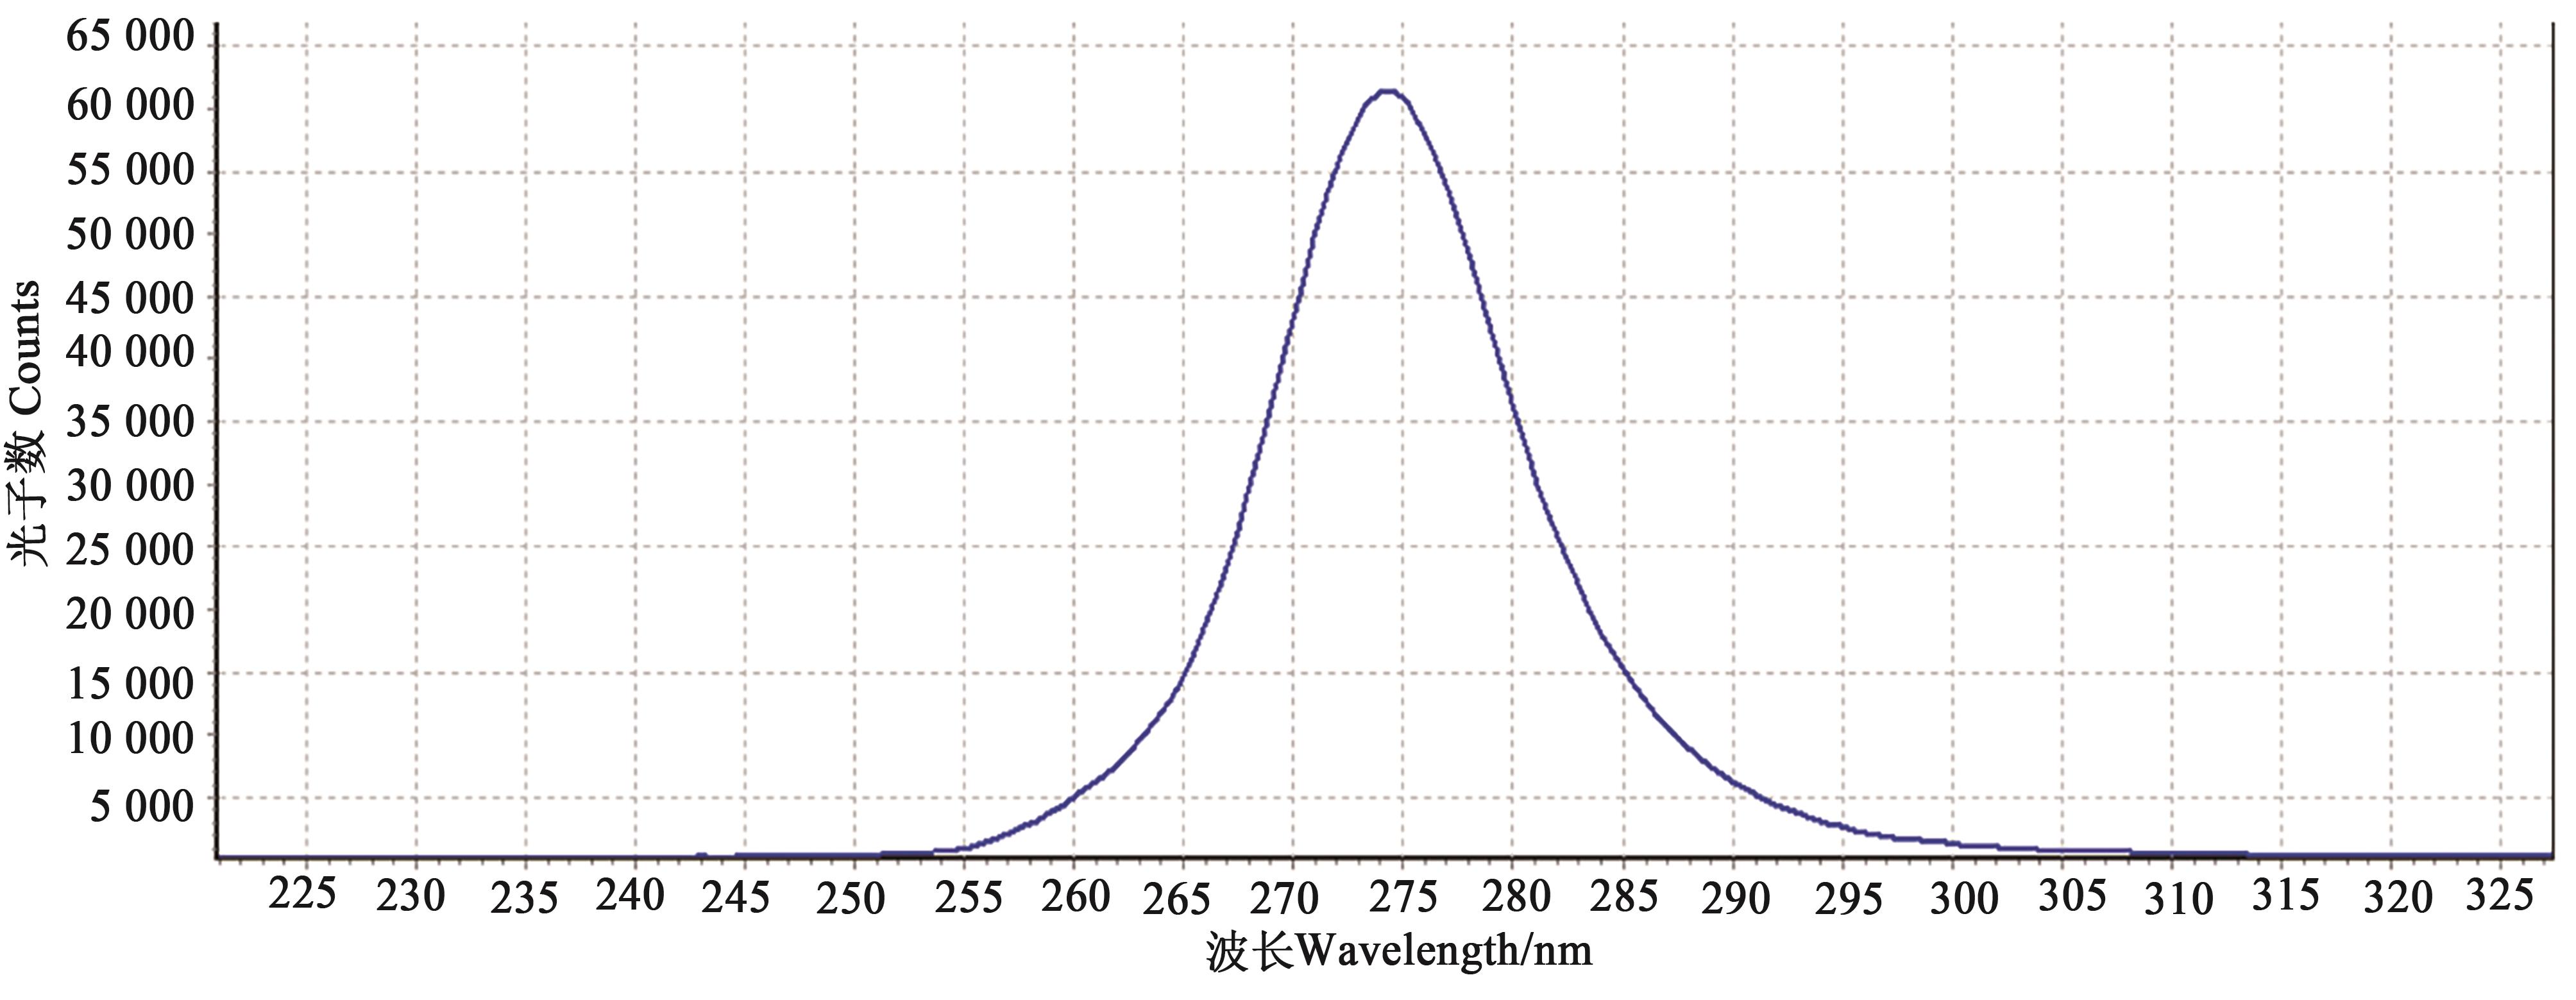
图 2 UV-LED光谱图
Fig. 2 Spectrum of UV-LED
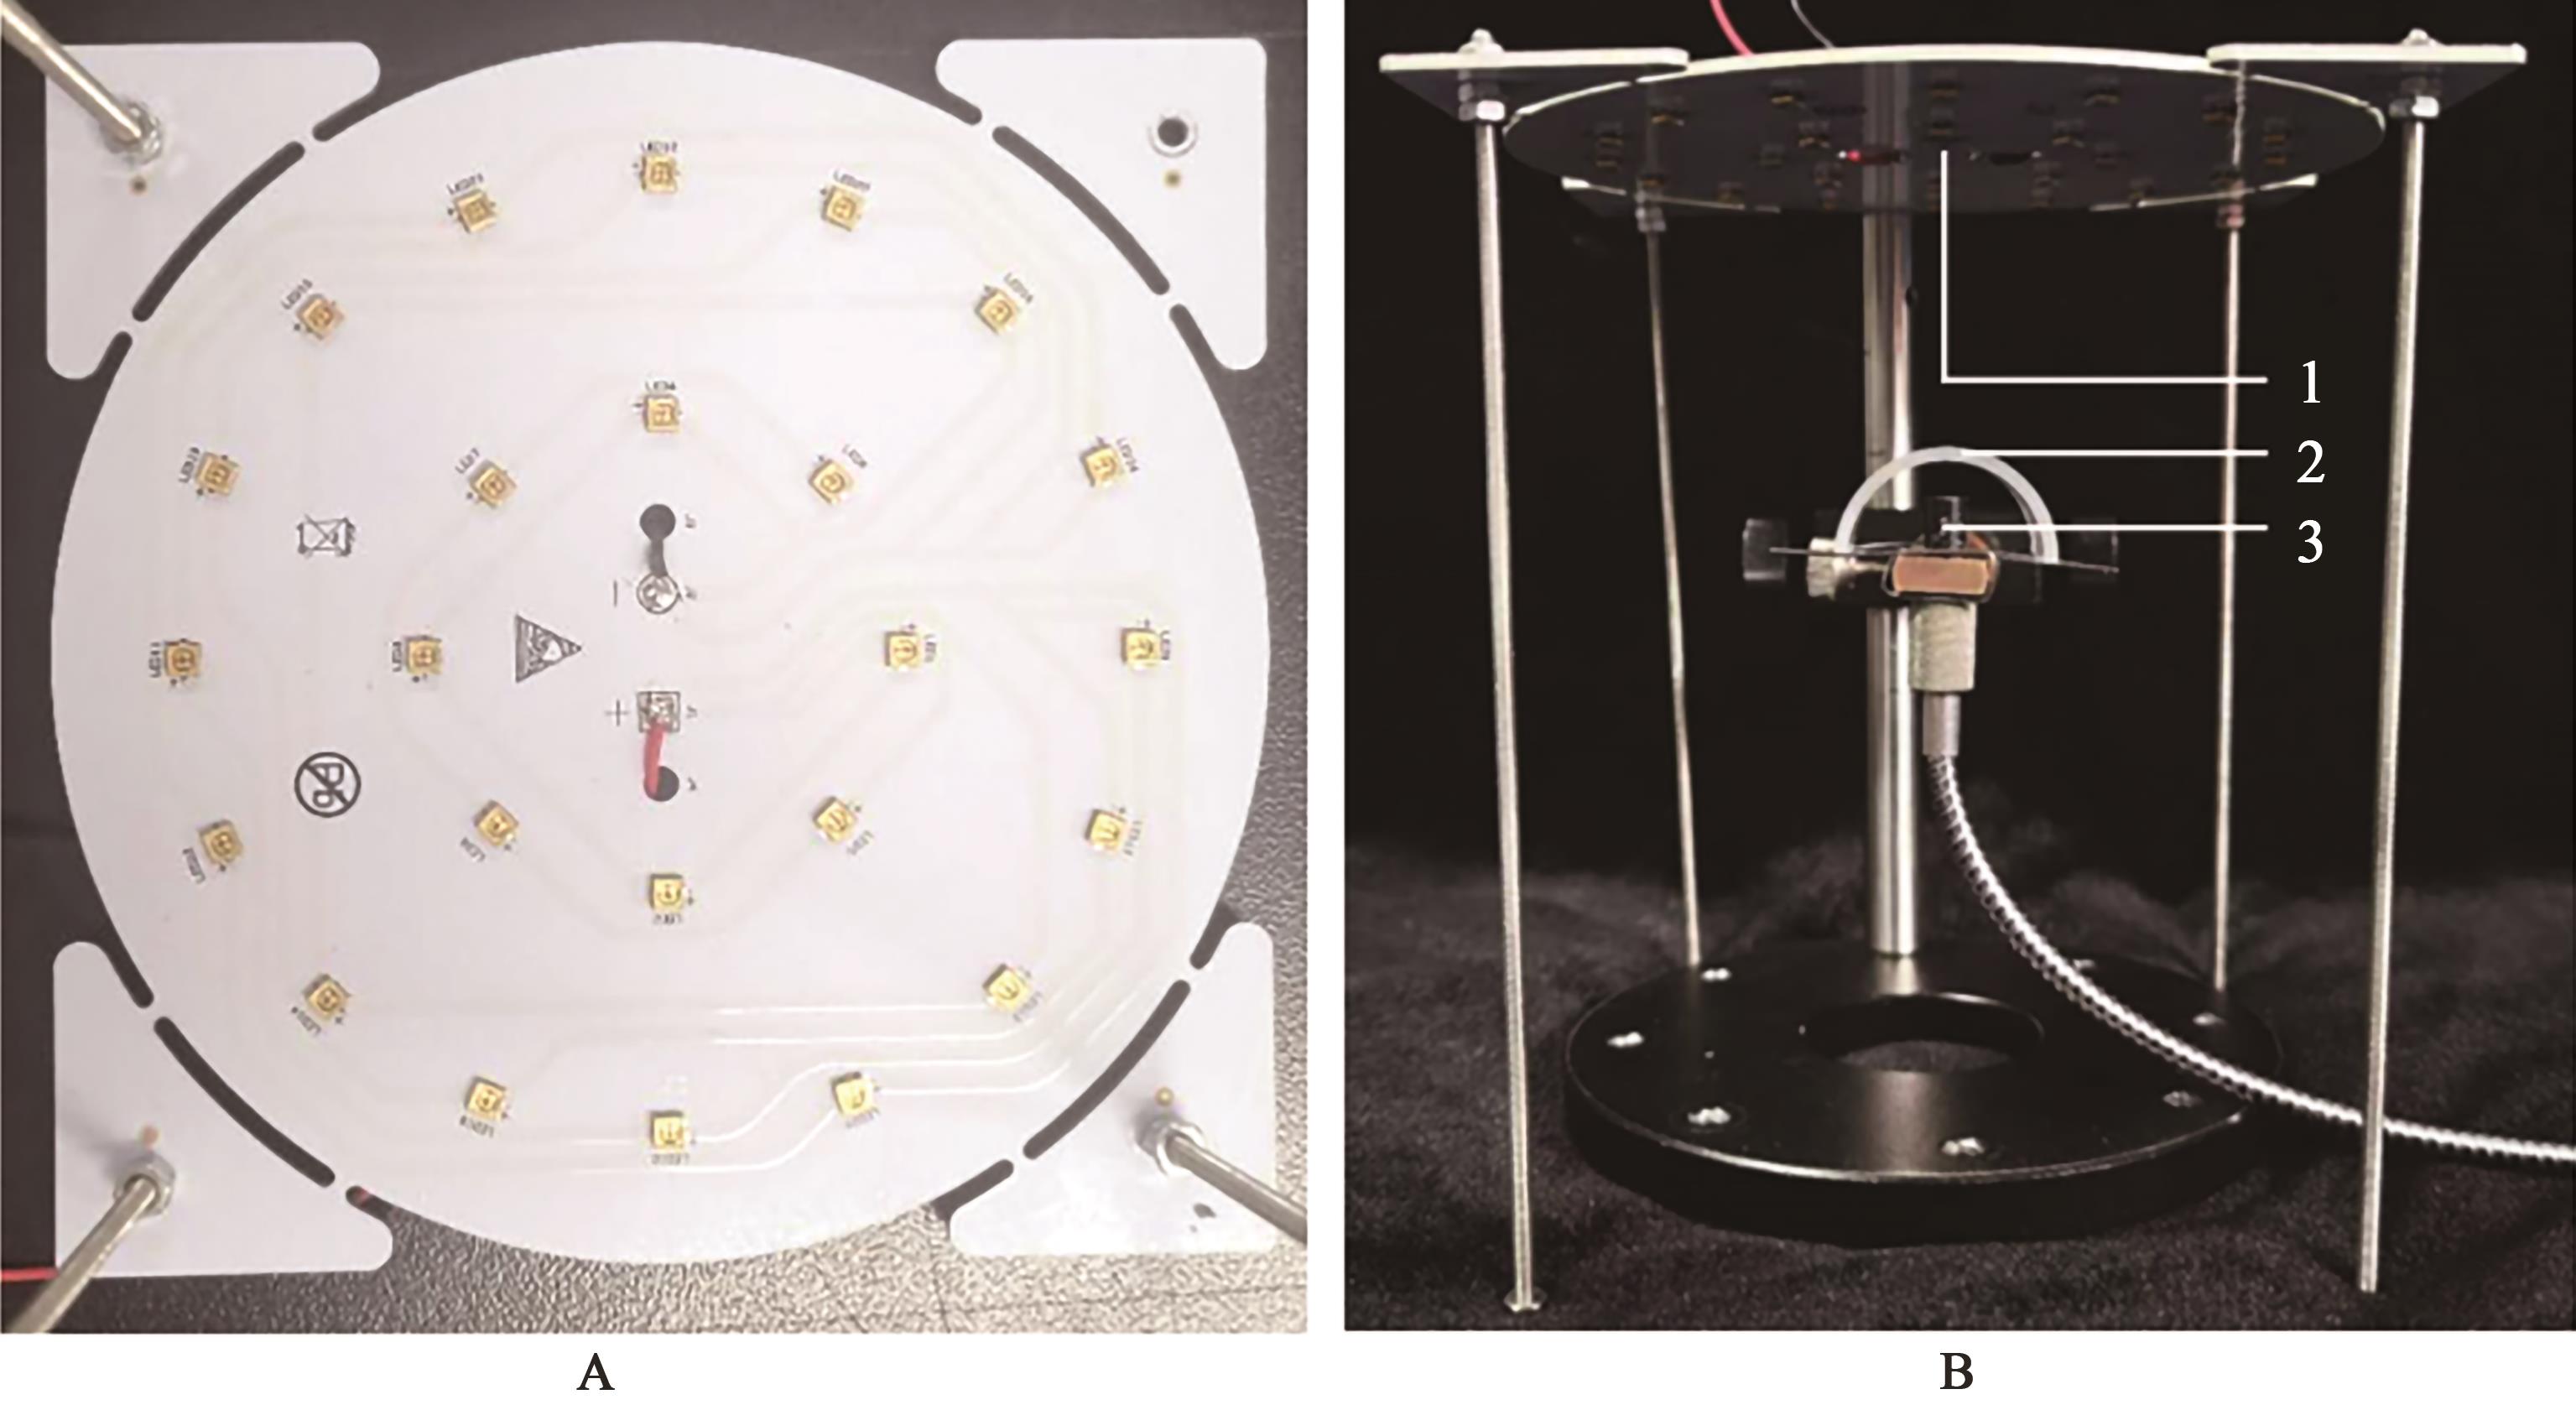
图3 石英管透过率测定A:UV-LED测量灯板;B:石英管紫外透过率测量装置。1—UV-LED测量灯板;2—与试验用石英管规格相同的半圆形石英片;3—紫外光谱仪的测量探头
Fig. 3 Measurement of transmittance for quartz tubeA:UV-LED measurement board; B:UV transmittance measurement device for quartz tube. 1—UV-LED measurement board; 2—Semicircular quartz plate with the same specifications as quartz tube; 3—Measurement probe of ultraviolet spectrometer
| 指标Index | 遮盖前Before covering | 遮盖后After covering | 透过率Transmittance |
|---|---|---|---|
| 辐照度Irradiance/(μW·cm-2) | 123.5 | 115.7 | 0.937 |
| 133.9 | 125.4 | 0.937 | |
| 144.8 | 136.9 | 0.945 | |
| 157.1 | 146.2 | 0.931 | |
| 194.9 | 175.5 | 0.900 |
表1 石英片遮盖前后紫外辐照度及透过率
Table 1 UV irradiance before and after covering the quartz plate and its transmittance
| 指标Index | 遮盖前Before covering | 遮盖后After covering | 透过率Transmittance |
|---|---|---|---|
| 辐照度Irradiance/(μW·cm-2) | 123.5 | 115.7 | 0.937 |
| 133.9 | 125.4 | 0.937 | |
| 144.8 | 136.9 | 0.945 | |
| 157.1 | 146.2 | 0.931 | |
| 194.9 | 175.5 | 0.900 |
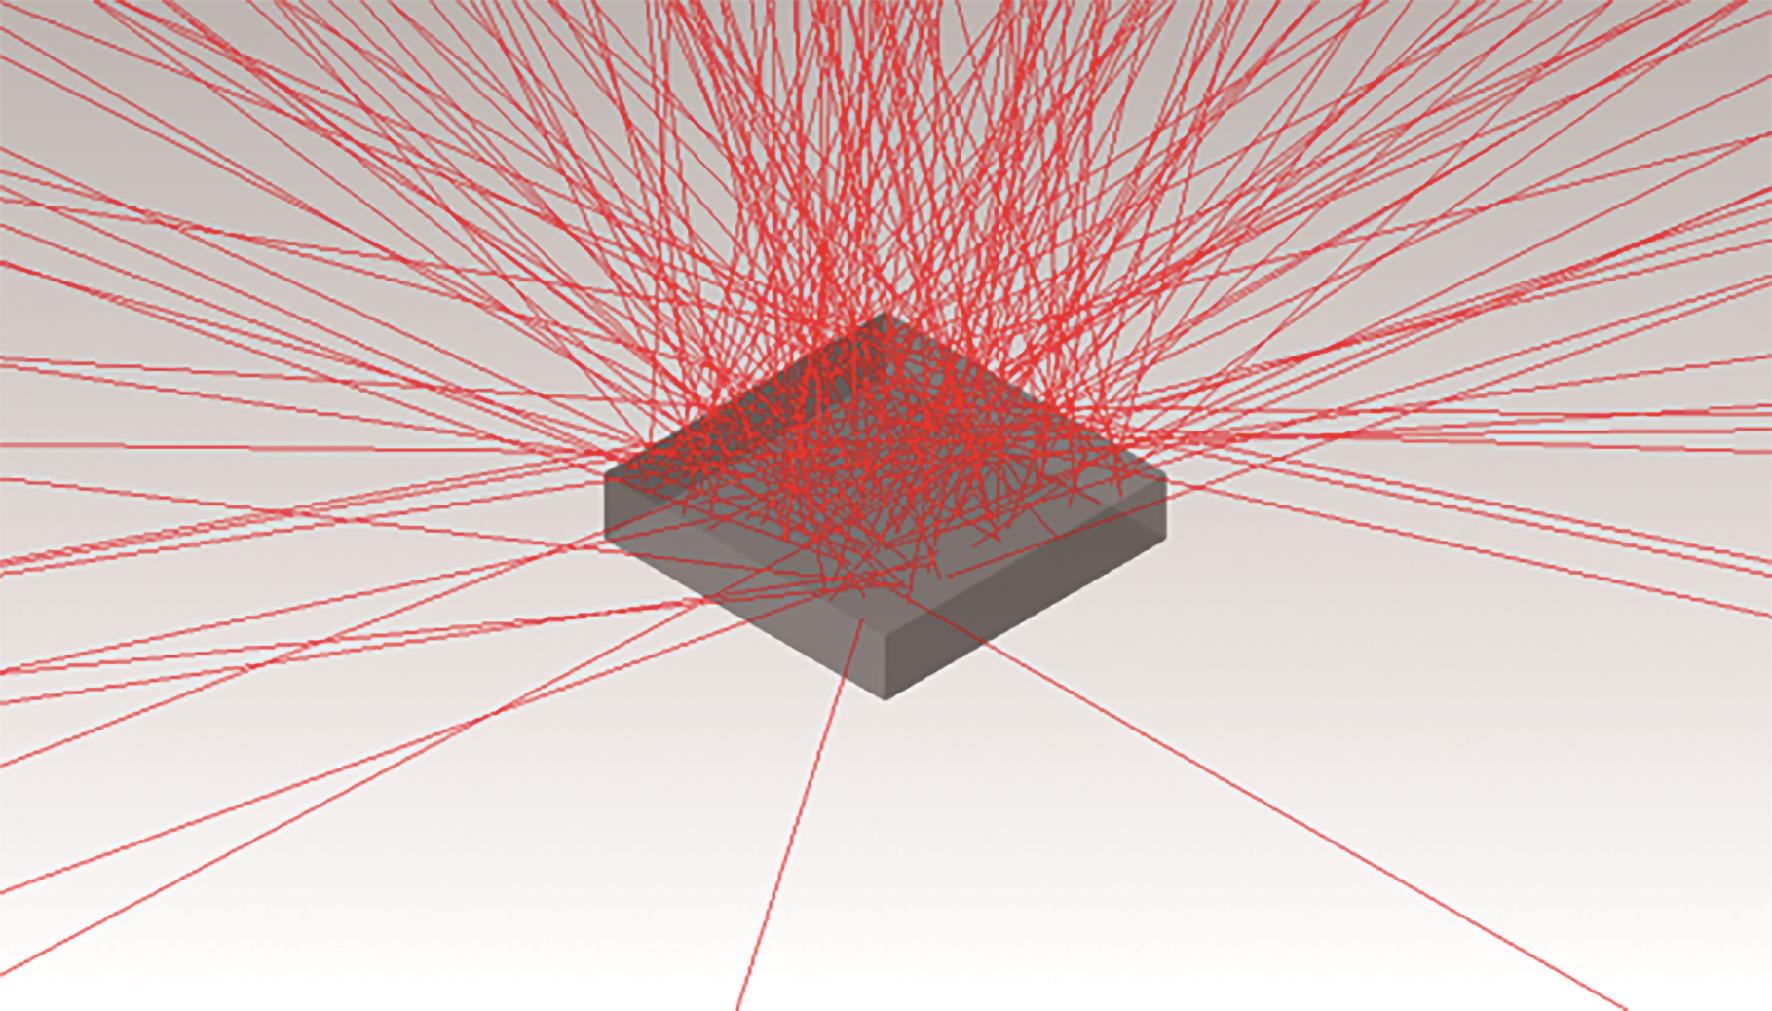
图4 UV-LED灯珠模型光线追迹
Fig. 4 Lighting of UV-LED bead model
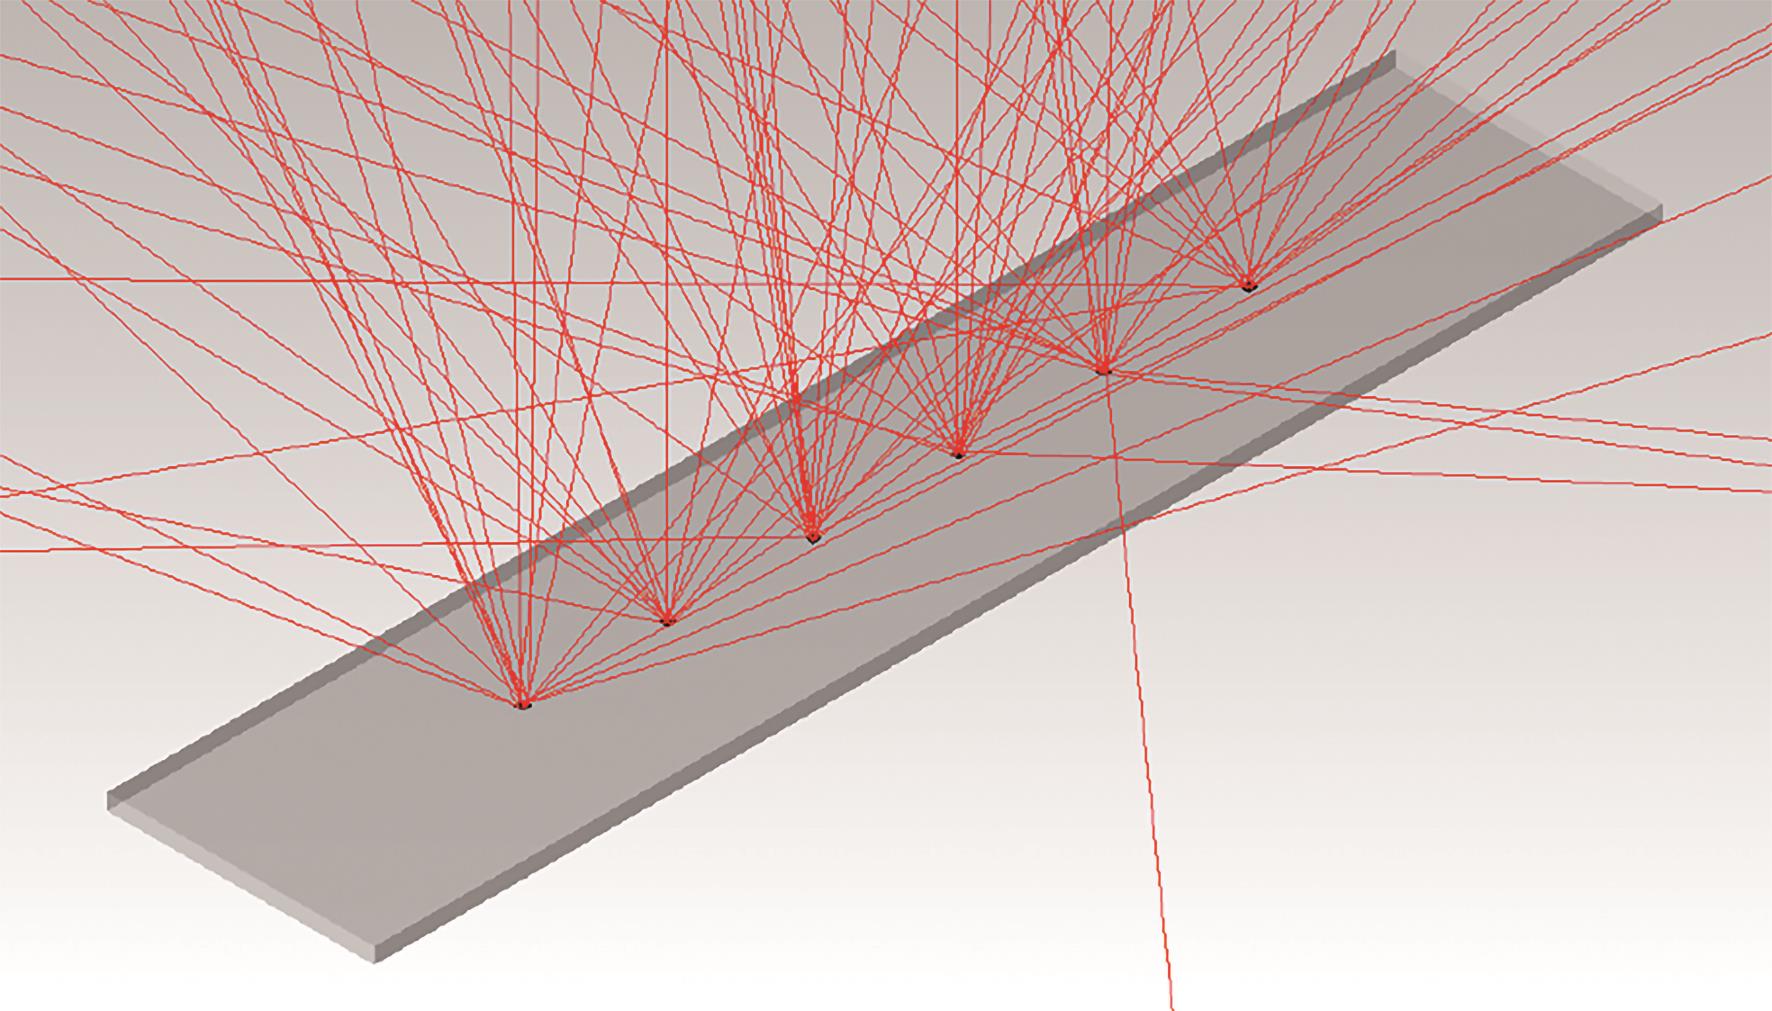
图5 UV-LED灯条模型光线追迹
Fig. 5 Lighting of UV-LED bar model
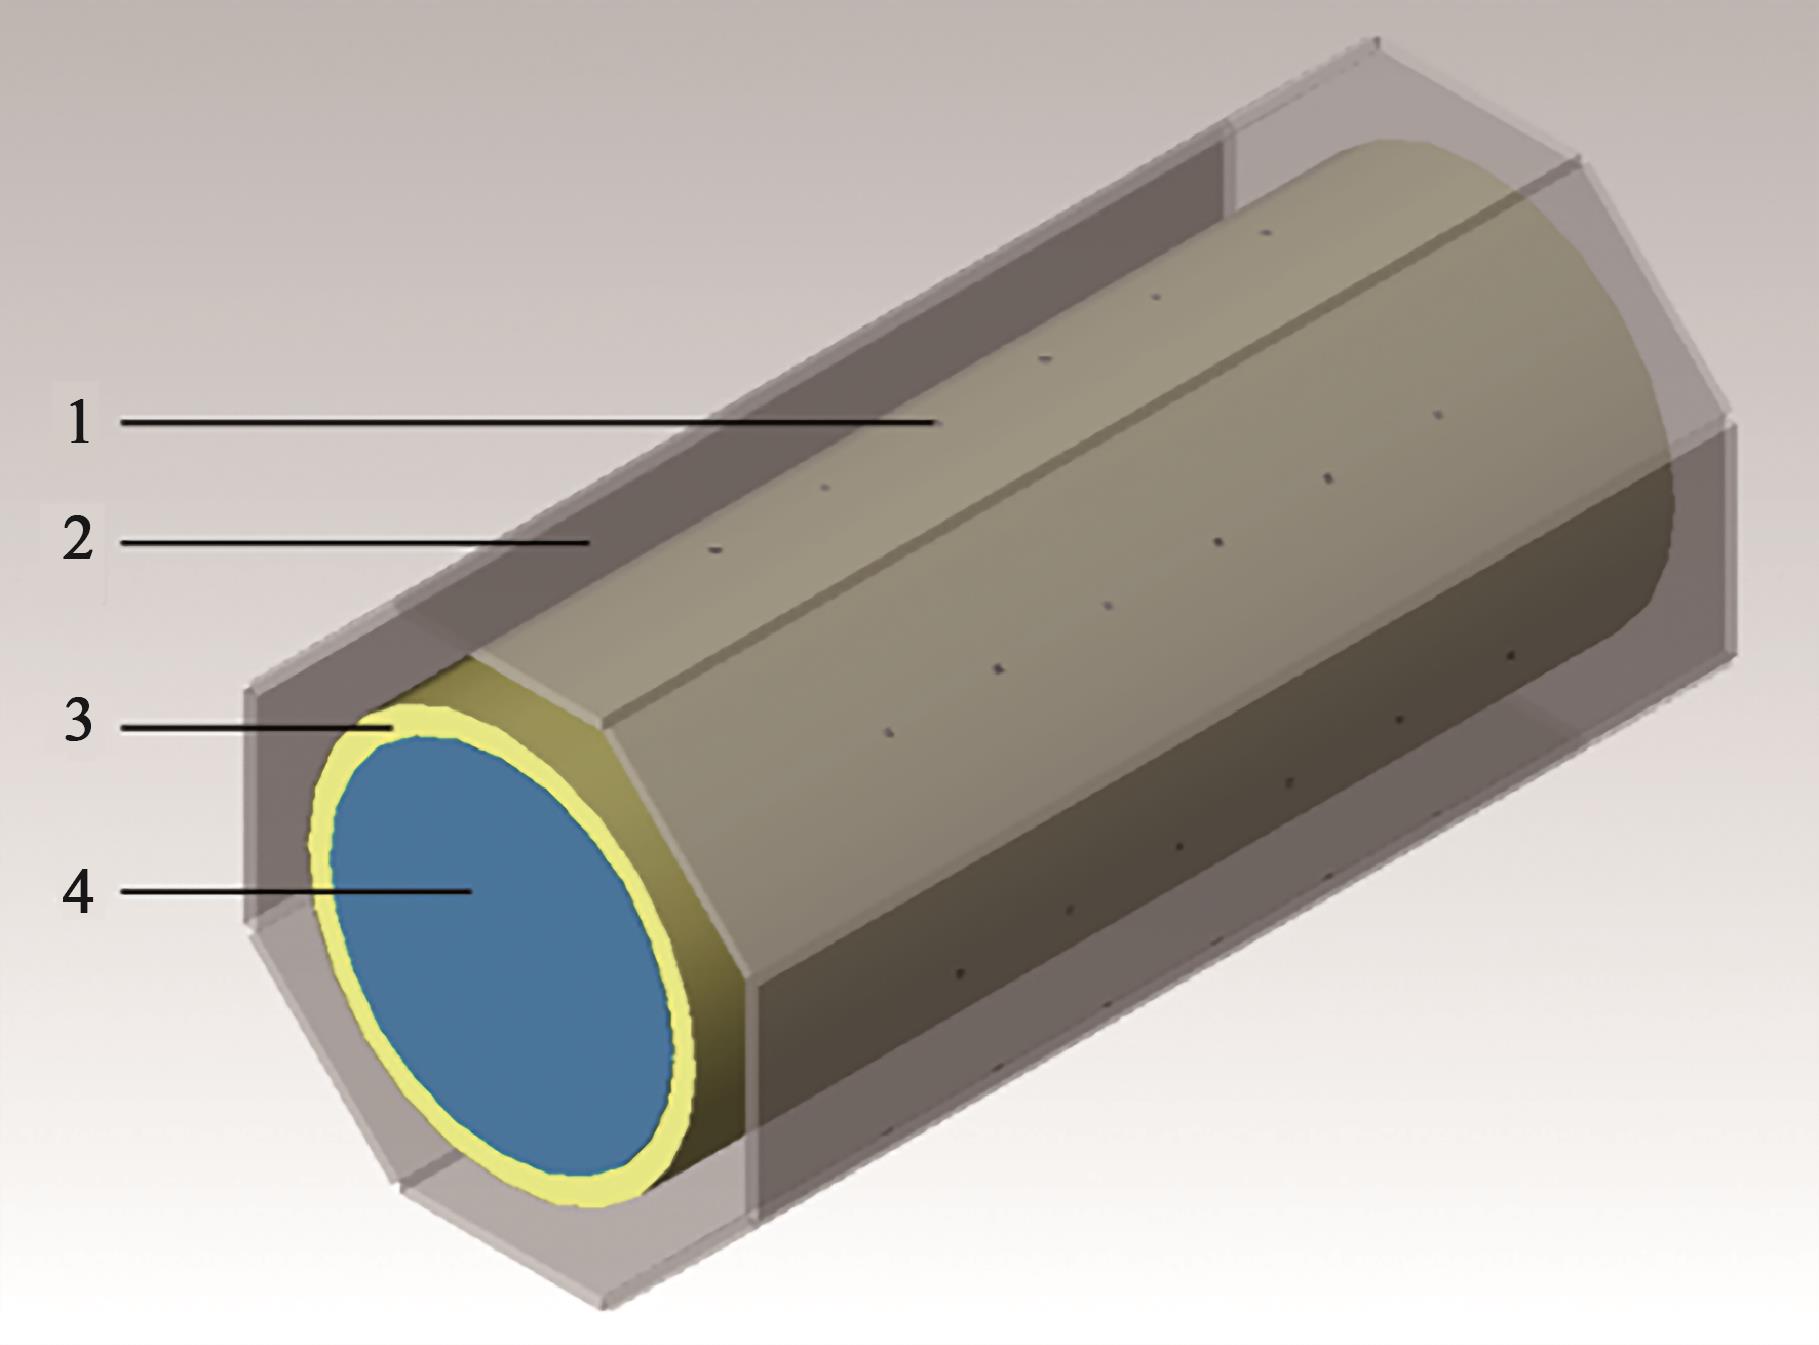
图6 UV-NSS模组模型注:1—UV-LED灯珠模型;2—UV-LED灯条模型;3—石英管模; 4—液体模型。
Fig. 6 UV-NSS module modelNote:1—UV-LED bead model; 2—UV-LED bar model; 3—Quartz tube model; 4—Liquid model.
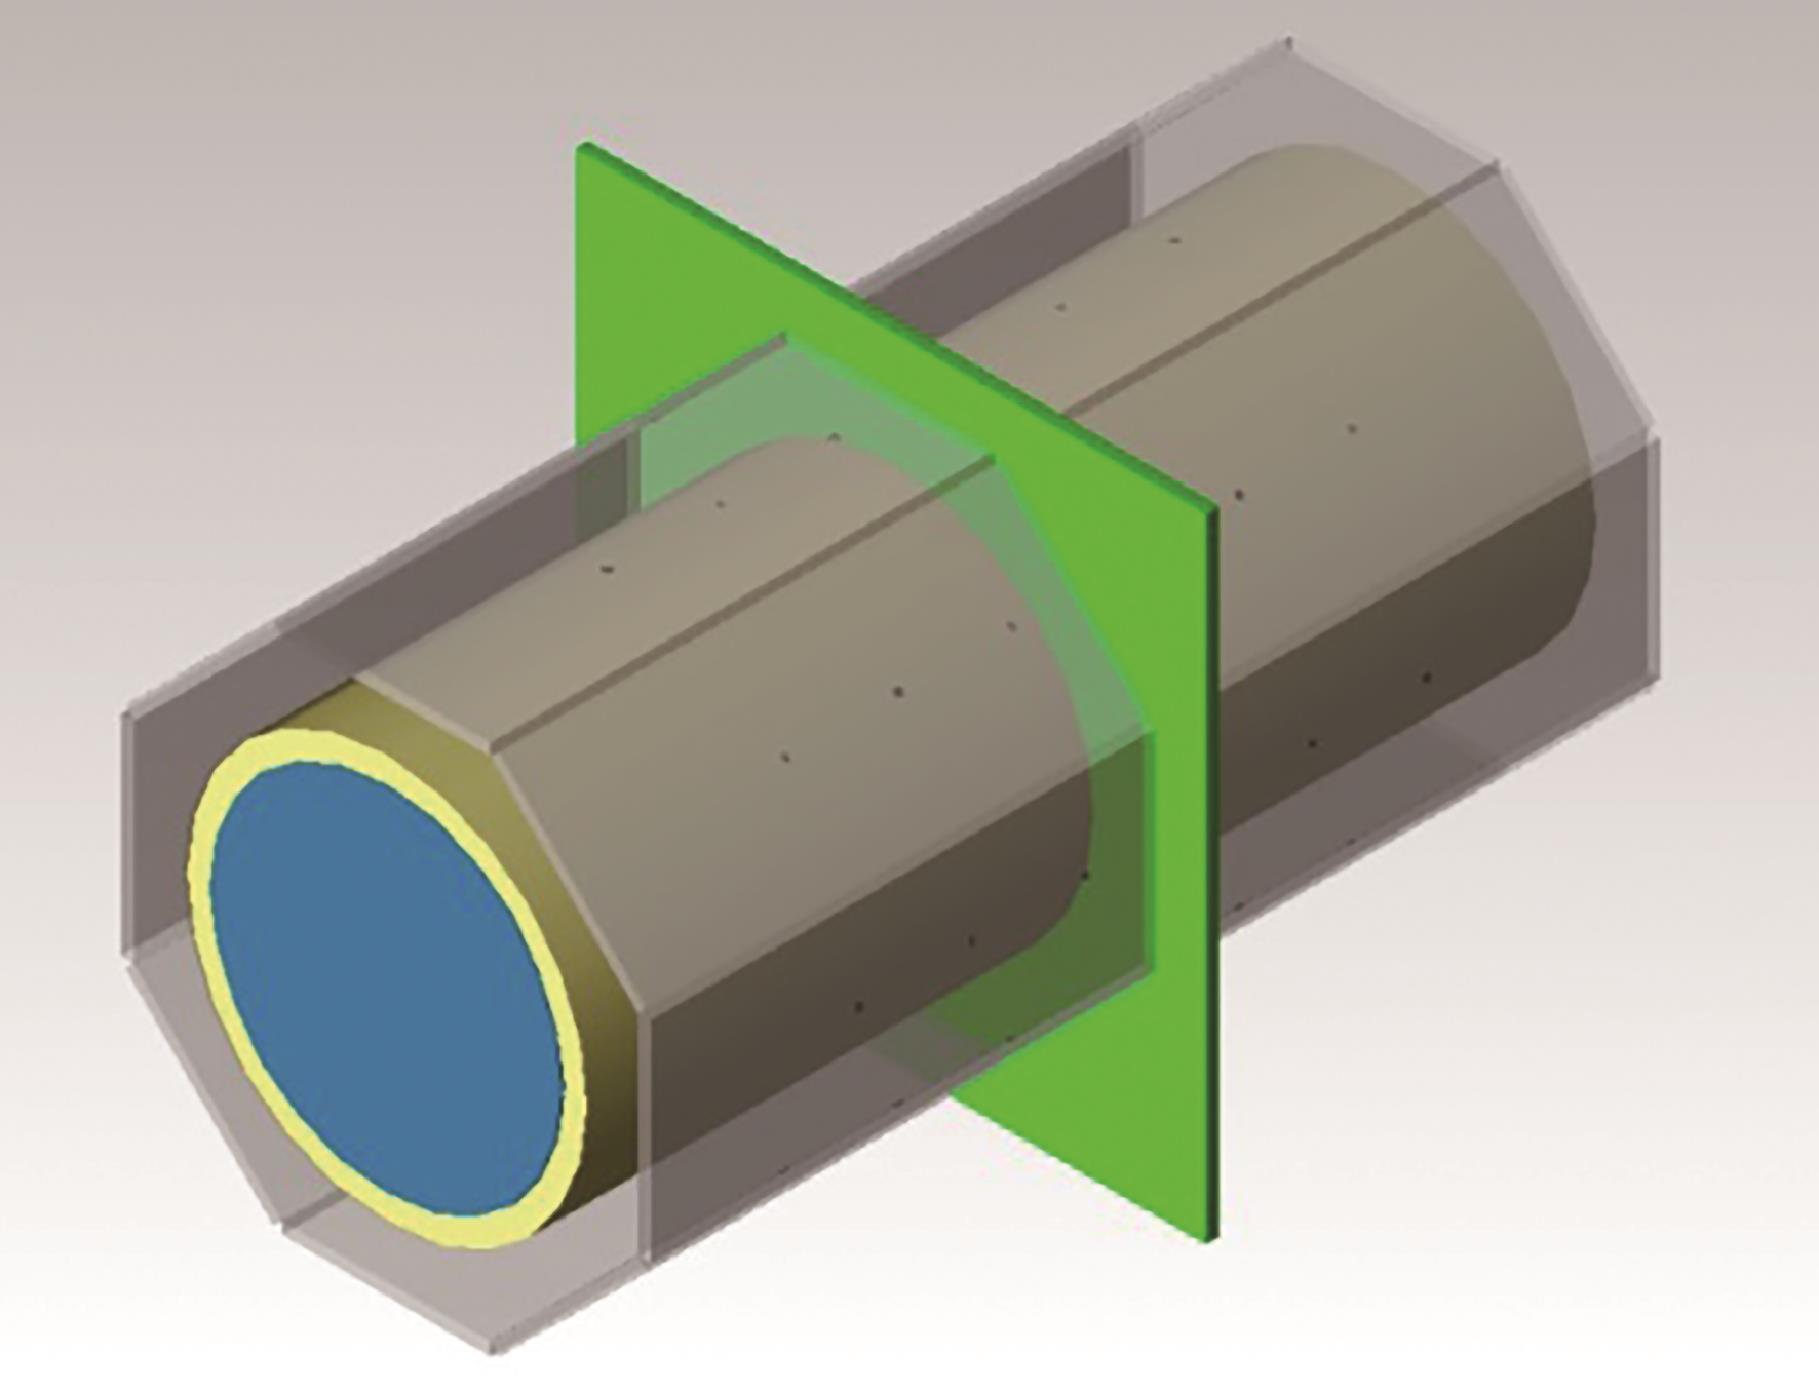
图7 参考面在模型中的位置
Fig. 7 Position of the reference surface in the model
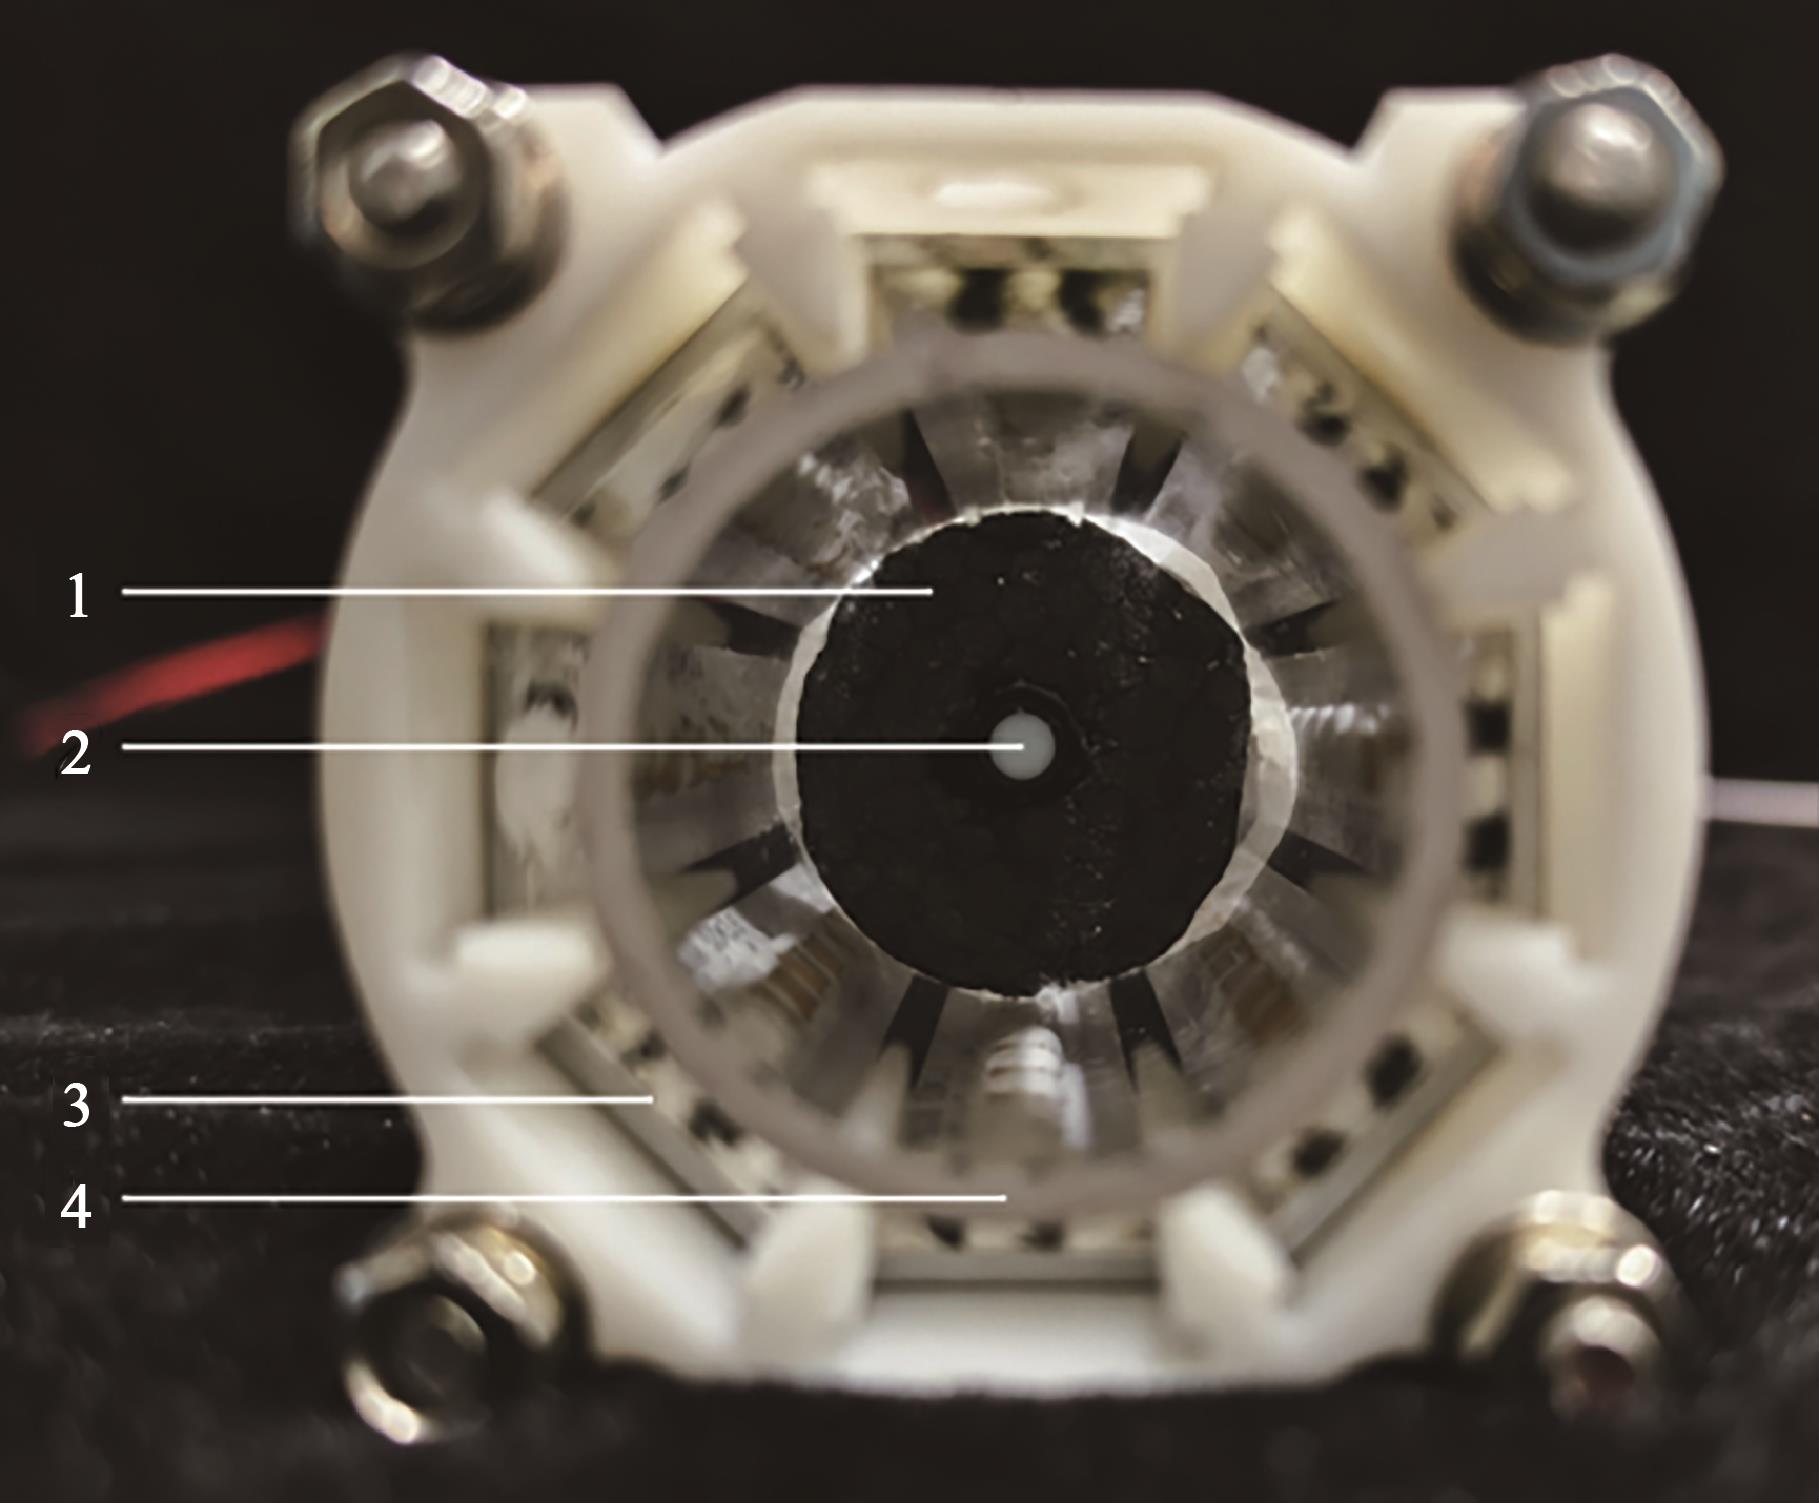
图8 UV-NSS模组辐照度实测注:1—光谱仪探头受光面;2—探头固定件;3—UV-LED灯条;4—石英管。
Fig. 8 Measurement of UV-NSS module irradianceNote:1—Light-receiving surface of spectrometer probe; 2—Probe fixture; 3—UV-LED bar; 4—Quartz tube.
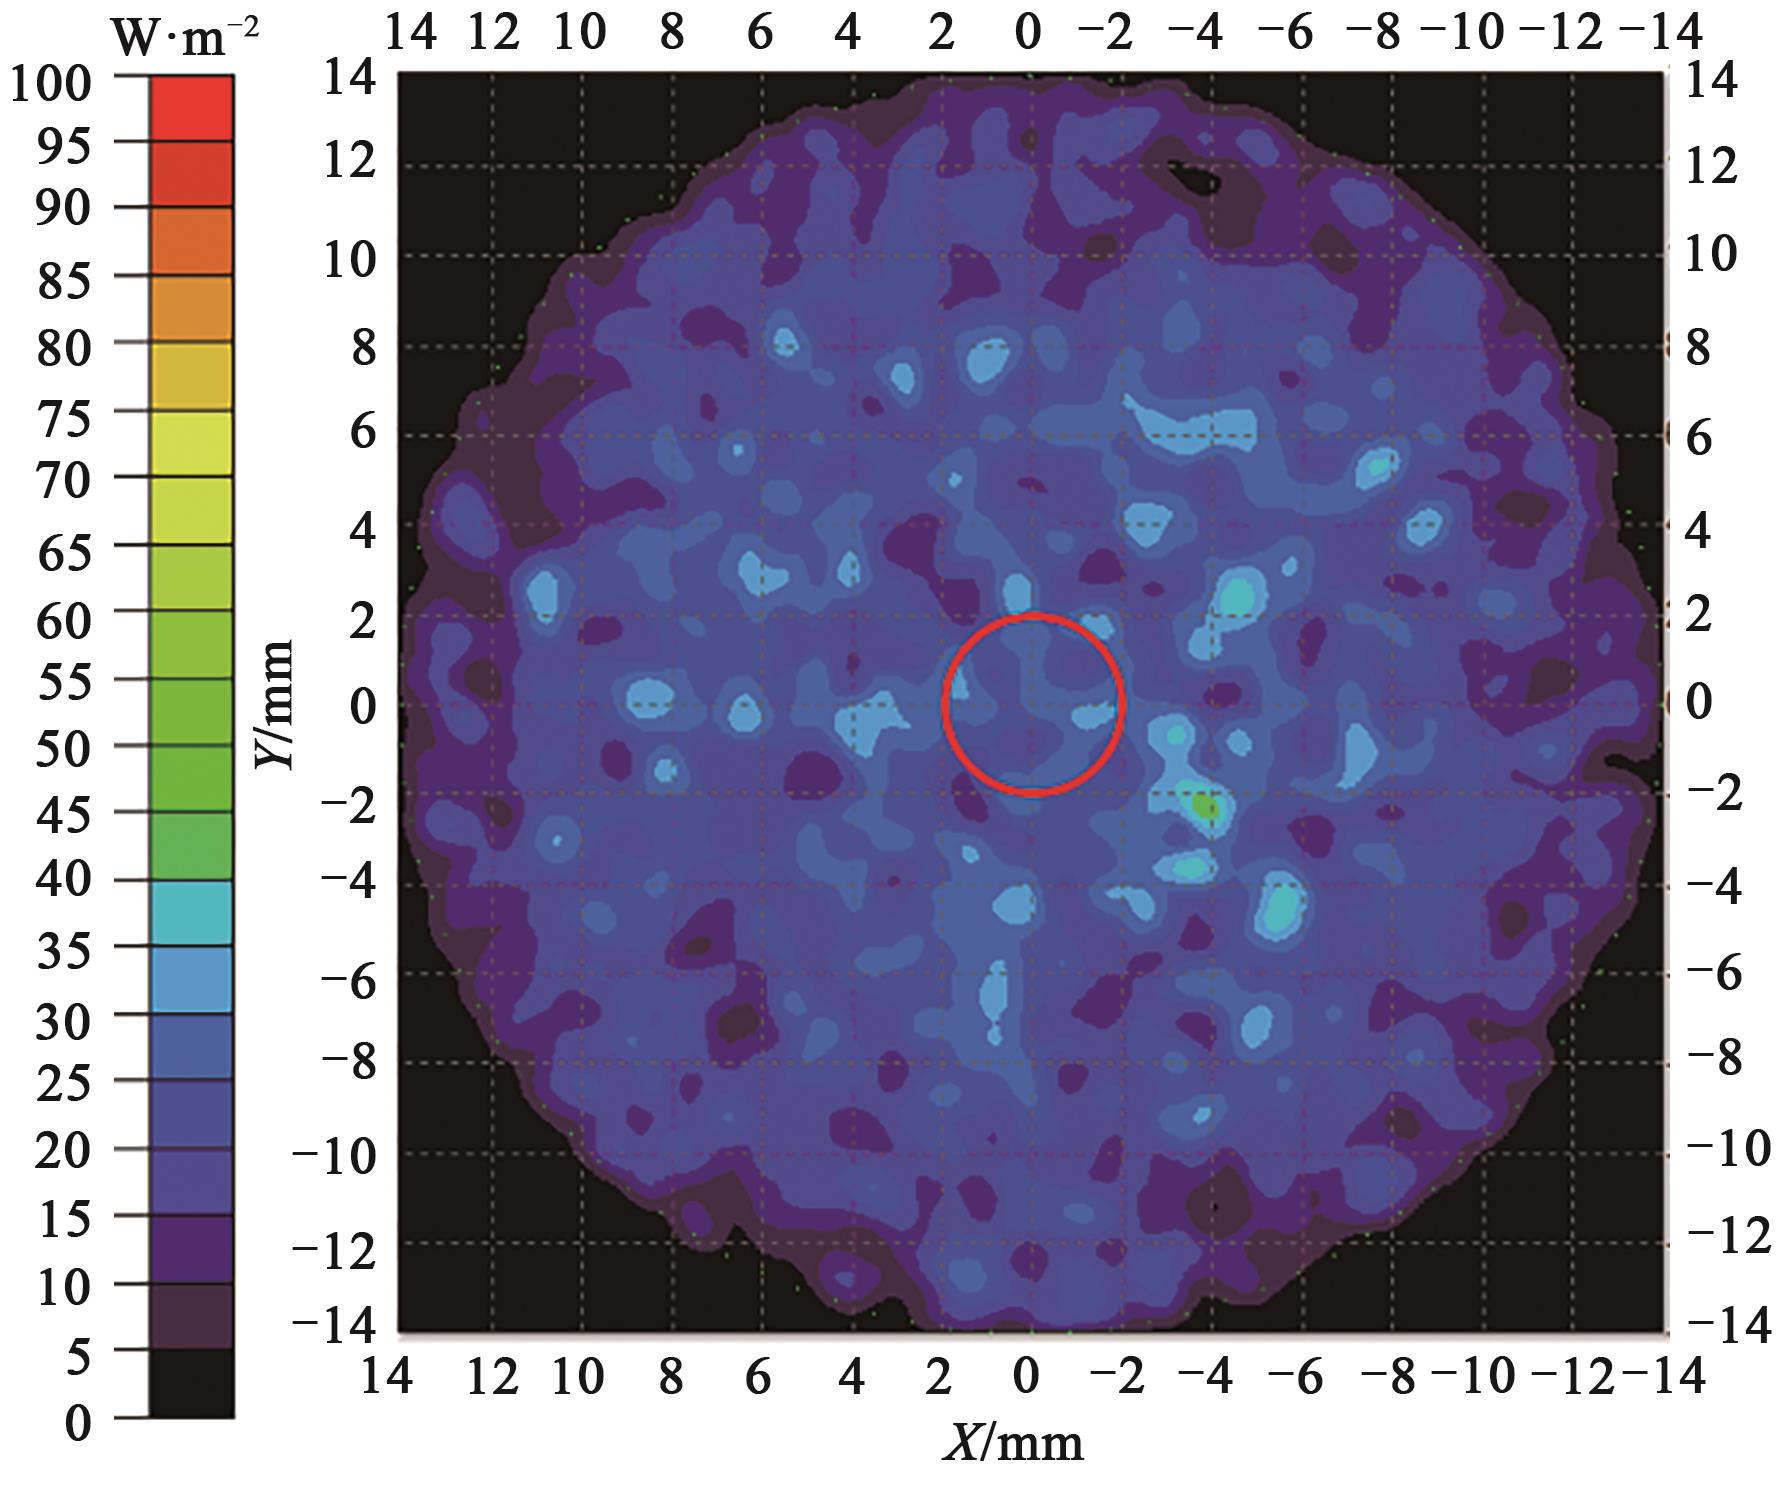
图9 单侧发光下参考面紫外辐照分布及光谱仪探头受光面对应位置
Fig. 9 Ultraviolet irradiance distribution of the reference surface and the corresponding position of the light-receiving surface of the spectrometer probe under unilateral lighting
| 因子Factor | 编码Coding | 水平Level | ||||
|---|---|---|---|---|---|---|
| -2 | -1 | 0 | 1 | 2 | ||
| 管道内径Inner diameter of tube/mm | A | 24.00 | 30.50 | 37.00 | 43.50 | 50.00 |
| 管壁厚度Thickness of tube wall/mm | B | 0.00 | 0.75 | 1.50 | 2.25 | 3.00 |
| 管灯距离Tube-lamp distance/mm | C | 0.00 | 1.25 | 2.50 | 3.75 | 5.00 |
| 双向反射分布函数BRDF | D | 0.00 | 0.25 | 0.50 | 0.75 | 1.00 |
表2 参数因子水平及其编码表
Table 2 Parameter factor level and code
| 因子Factor | 编码Coding | 水平Level | ||||
|---|---|---|---|---|---|---|
| -2 | -1 | 0 | 1 | 2 | ||
| 管道内径Inner diameter of tube/mm | A | 24.00 | 30.50 | 37.00 | 43.50 | 50.00 |
| 管壁厚度Thickness of tube wall/mm | B | 0.00 | 0.75 | 1.50 | 2.25 | 3.00 |
| 管灯距离Tube-lamp distance/mm | C | 0.00 | 1.25 | 2.50 | 3.75 | 5.00 |
| 双向反射分布函数BRDF | D | 0.00 | 0.25 | 0.50 | 0.75 | 1.00 |
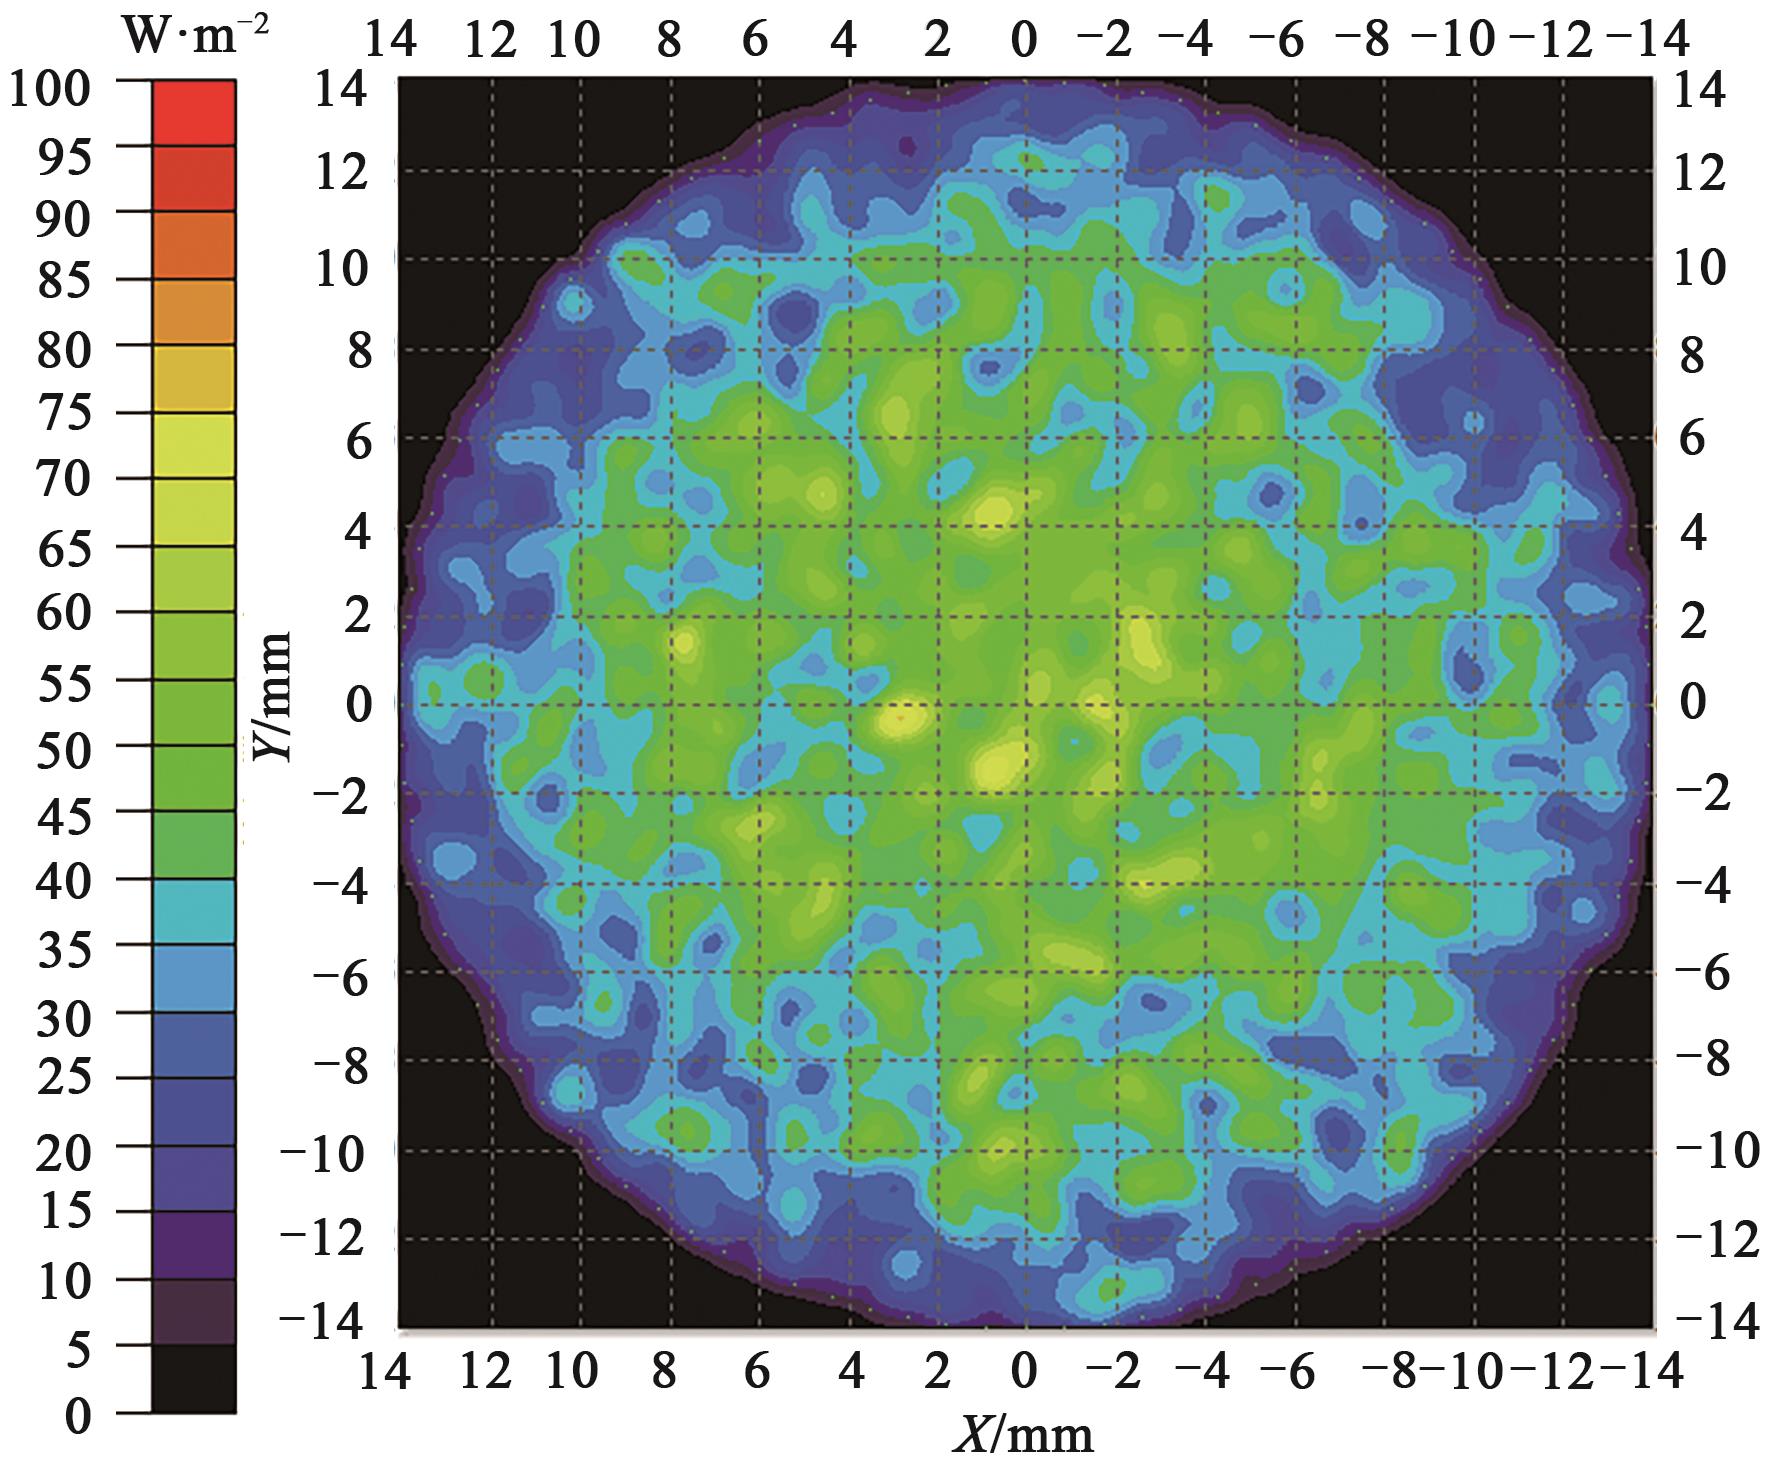
图10 UV-NSS模组模型参考面紫外辐照分布
Fig. 10 Ultraviolet radiation distribution on the UV-NSS module model reference surface
| 试验序号Number of experiment | 试验设计组合Experiment design combination | 试验结果Experiment result | |||||
|---|---|---|---|---|---|---|---|
| A | B | C | D | EURR/% | ID | ||
| 1 | -1 | -1 | -1 | -1 | 18.94 | 0.381 2 | |
| 2 | 1 | -1 | -1 | -1 | 24.66 | 0.387 9 | |
| 3 | -1 | 1 | -1 | -1 | 18.60 | 0.303 3 | |
| 4 | 1 | 1 | -1 | -1 | 24.09 | 0.325 7 | |
| 5 | -1 | -1 | 1 | -1 | 15.96 | 0.312 4 | |
| 6 | 1 | -1 | 1 | -1 | 21.30 | 0.314 8 | |
| 7 | -1 | 1 | 1 | -1 | 15.30 | 0.272 6 | |
表3 仿真试验设计方案及结果
Table 3 Design scheme and results of simulation experiments
| 试验序号Number of experiment | 试验设计组合Experiment design combination | 试验结果Experiment result | |||||
|---|---|---|---|---|---|---|---|
| A | B | C | D | EURR/% | ID | ||
| 1 | -1 | -1 | -1 | -1 | 18.94 | 0.381 2 | |
| 2 | 1 | -1 | -1 | -1 | 24.66 | 0.387 9 | |
| 3 | -1 | 1 | -1 | -1 | 18.60 | 0.303 3 | |
| 4 | 1 | 1 | -1 | -1 | 24.09 | 0.325 7 | |
| 5 | -1 | -1 | 1 | -1 | 15.96 | 0.312 4 | |
| 6 | 1 | -1 | 1 | -1 | 21.30 | 0.314 8 | |
| 7 | -1 | 1 | 1 | -1 | 15.30 | 0.272 6 | |
| 试验序号Number of experiment | 试验设计组合Experiment design combination | 试验结果Experiment result | |||||
|---|---|---|---|---|---|---|---|
| A | B | C | D | EURR/% | ID | ||
| 8 | 1 | 1 | 1 | -1 | 20.58 | 0.280 1 | |
| 9 | -1 | -1 | -1 | 1 | 33.20 | 0.342 9 | |
| 10 | 1 | -1 | -1 | 1 | 37.88 | 0.358 5 | |
| 11 | -1 | 1 | -1 | 1 | 31.36 | 0.279 5 | |
| 12 | 1 | 1 | -1 | 1 | 35.00 | 0.305 8 | |
| 13 | -1 | -1 | 1 | 1 | 27.40 | 0.303 8 | |
| 14 | 1 | -1 | 1 | 1 | 31.31 | 0.307 9 | |
| 15 | -1 | 1 | 1 | 1 | 24.73 | 0.261 8 | |
| 16 | 1 | 1 | 1 | 1 | 29.36 | 0.271 5 | |
| 17 | -2 | 0 | 0 | 0 | 17.43 | 0.274 2 | |
| 18 | 2 | 0 | 0 | 0 | 29.12 | 0.310 6 | |
| 19 | 0 | -2 | 0 | 0 | 28.01 | 0.357 4 | |
| 20 | 0 | 2 | 0 | 0 | 23.18 | 0.263 6 | |
| 21 | 0 | 0 | -2 | 0 | 28.85 | 0.412 3 | |
| 22 | 0 | 0 | 2 | 0 | 19.56 | 0.294 9 | |
| 23 | 0 | 0 | 0 | -2 | 17.94 | 0.314 0 | |
| 24 | 0 | 0 | 0 | 2 | 49.78 | 0.298 9 | |
| 25 | 0 | 0 | 0 | 0 | 24.61 | 0.304 7 | |
表3 仿真试验设计方案及结果 (续表Continued)
Table 3 Design scheme and results of simulation experimentsxu
| 试验序号Number of experiment | 试验设计组合Experiment design combination | 试验结果Experiment result | |||||
|---|---|---|---|---|---|---|---|
| A | B | C | D | EURR/% | ID | ||
| 8 | 1 | 1 | 1 | -1 | 20.58 | 0.280 1 | |
| 9 | -1 | -1 | -1 | 1 | 33.20 | 0.342 9 | |
| 10 | 1 | -1 | -1 | 1 | 37.88 | 0.358 5 | |
| 11 | -1 | 1 | -1 | 1 | 31.36 | 0.279 5 | |
| 12 | 1 | 1 | -1 | 1 | 35.00 | 0.305 8 | |
| 13 | -1 | -1 | 1 | 1 | 27.40 | 0.303 8 | |
| 14 | 1 | -1 | 1 | 1 | 31.31 | 0.307 9 | |
| 15 | -1 | 1 | 1 | 1 | 24.73 | 0.261 8 | |
| 16 | 1 | 1 | 1 | 1 | 29.36 | 0.271 5 | |
| 17 | -2 | 0 | 0 | 0 | 17.43 | 0.274 2 | |
| 18 | 2 | 0 | 0 | 0 | 29.12 | 0.310 6 | |
| 19 | 0 | -2 | 0 | 0 | 28.01 | 0.357 4 | |
| 20 | 0 | 2 | 0 | 0 | 23.18 | 0.263 6 | |
| 21 | 0 | 0 | -2 | 0 | 28.85 | 0.412 3 | |
| 22 | 0 | 0 | 2 | 0 | 19.56 | 0.294 9 | |
| 23 | 0 | 0 | 0 | -2 | 17.94 | 0.314 0 | |
| 24 | 0 | 0 | 0 | 2 | 49.78 | 0.298 9 | |
| 25 | 0 | 0 | 0 | 0 | 24.61 | 0.304 7 | |
| 来源Source | 和方差Sum of squares | 自由度Degree of freedom | 均方Mean square | F值F value | P值P value |
|---|---|---|---|---|---|
| 模型 Model | 1 461.900 0 | 14 | 104.420 0 | 27.710 0 | <0.000 1 |
| A | 160.530 0 | 1 | 160.530 0 | 42.600 0 | <0.000 1 |
| B | 18.890 0 | 1 | 18.890 0 | 5.010 0 | 0.049 1 |
| C | 132.400 0 | 1 | 132.400 0 | 35.130 0 | 0.000 1 |
| D | 994.470 0 | 1 | 994.470 0 | 263.900 0 | <0.000 1 |
| AB | 0.023 3 | 1 | 0.023 3 | 0.006 2 | 0.938 9 |
| AC | 0.008 6 | 1 | 0.008 6 | 0.002 3 | 0.962 9 |
| AD | 1.540 0 | 1 | 1.540 0 | 0.409 7 | 0.536 5 |
| BC | 0.008 6 | 1 | 0.008 6 | 0.002 3 | 0.962 9 |
| BD | 3.110 0 | 1 | 3.110 0 | 0.824 3 | 0.385 3 |
| CD | 8.250 0 | 1 | 8.250 0 | 2.190 0 | 0.169 7 |
| A2 | 3.080 0 | 1 | 3.080 0 | 0.816 6 | 0.387 4 |
| B2 | 0.038 0 | 1 | 0.038 0 | 0.010 1 | 0.922 0 |
| C2 | 0.946 4 | 1 | 0.946 4 | 0.251 2 | 0.627 1 |
| D2 | 50.970 0 | 1 | 50.970 0 | 13.520 0 | 0.004 3 |
| 残差Residual | 37.680 0 | 10 | 3.770 0 | — | — |
| 总和Cor total | 1 499.580 0 | 24 | — | — | — |
表4 以有效紫外辐照比例为考察指标的回归系数检验表
Table 4 Analysis of regression coefficient test of the effective ultraviolet radiation ratio
| 来源Source | 和方差Sum of squares | 自由度Degree of freedom | 均方Mean square | F值F value | P值P value |
|---|---|---|---|---|---|
| 模型 Model | 1 461.900 0 | 14 | 104.420 0 | 27.710 0 | <0.000 1 |
| A | 160.530 0 | 1 | 160.530 0 | 42.600 0 | <0.000 1 |
| B | 18.890 0 | 1 | 18.890 0 | 5.010 0 | 0.049 1 |
| C | 132.400 0 | 1 | 132.400 0 | 35.130 0 | 0.000 1 |
| D | 994.470 0 | 1 | 994.470 0 | 263.900 0 | <0.000 1 |
| AB | 0.023 3 | 1 | 0.023 3 | 0.006 2 | 0.938 9 |
| AC | 0.008 6 | 1 | 0.008 6 | 0.002 3 | 0.962 9 |
| AD | 1.540 0 | 1 | 1.540 0 | 0.409 7 | 0.536 5 |
| BC | 0.008 6 | 1 | 0.008 6 | 0.002 3 | 0.962 9 |
| BD | 3.110 0 | 1 | 3.110 0 | 0.824 3 | 0.385 3 |
| CD | 8.250 0 | 1 | 8.250 0 | 2.190 0 | 0.169 7 |
| A2 | 3.080 0 | 1 | 3.080 0 | 0.816 6 | 0.387 4 |
| B2 | 0.038 0 | 1 | 0.038 0 | 0.010 1 | 0.922 0 |
| C2 | 0.946 4 | 1 | 0.946 4 | 0.251 2 | 0.627 1 |
| D2 | 50.970 0 | 1 | 50.970 0 | 13.520 0 | 0.004 3 |
| 残差Residual | 37.680 0 | 10 | 3.770 0 | — | — |
| 总和Cor total | 1 499.580 0 | 24 | — | — | — |
| 来源Source | 和方差Sum of squares | 自由度Degree of freedom | 均方Mean square | F值F value | P值P value |
|---|---|---|---|---|---|
| 模型 Model | 0.037 6 | 14 | 0.002 7 | 45.42 | <0.000 1 |
| A | 0.001 2 | 1 | 0.001 2 | 19.77 | 0.001 2 |
| B | 0.014 8 | 1 | 0.014 8 | 250.84 | <0.000 1 |
| C | 0.014 7 | 1 | 0.014 7 | 249.16 | <0.000 1 |
| D | 0.001 3 | 1 | 0.001 3 | 21.95 | 0.000 9 |
| AB | 8.6E-05 | 1 | 8.6E-05 | 1.45 | 0.255 6 |
| AC | 0.000 1 | 1 | 0.000 1 | 2.36 | 0.155 2 |
| AD | 1.74E-05 | 1 | 1.74E-05 | 0.29 | 0.599 1 |
| BC | 0.000 7 | 1 | 0.000 7 | 11.28 | 0.007 3 |
| BD | 2.53E-05 | 1 | 2.53E-05 | 0.43 | 0.528 2 |
| CD | 0.000 4 | 1 | 0.000 4 | 6.18 | 0.032 2 |
| A2 | 0.000 1 | 1 | 0.000 1 | 2.36 | 0.155 7 |
| B2 | 1.16E-05 | 1 | 1.16E-05 | 0.20 | 0.667 9 |
| C2 | 0.001 6 | 1 | 0.001 6 | 26.53 | 0.000 4 |
| D2 | 1.23E-11 | 1 | 1.23E-11 | 2.07E-07 | 0.999 6 |
| 残差Residual | 0.000 6 | 10 | 5.91E-05 | — | — |
| 总和Cor total | 0.038 2 | 24 | — | — | — |
表5 以辐照离散度为考察指标的回归系数检验表
Table 5 Analysis of regression coefficient test of the irradiance dispersion
| 来源Source | 和方差Sum of squares | 自由度Degree of freedom | 均方Mean square | F值F value | P值P value |
|---|---|---|---|---|---|
| 模型 Model | 0.037 6 | 14 | 0.002 7 | 45.42 | <0.000 1 |
| A | 0.001 2 | 1 | 0.001 2 | 19.77 | 0.001 2 |
| B | 0.014 8 | 1 | 0.014 8 | 250.84 | <0.000 1 |
| C | 0.014 7 | 1 | 0.014 7 | 249.16 | <0.000 1 |
| D | 0.001 3 | 1 | 0.001 3 | 21.95 | 0.000 9 |
| AB | 8.6E-05 | 1 | 8.6E-05 | 1.45 | 0.255 6 |
| AC | 0.000 1 | 1 | 0.000 1 | 2.36 | 0.155 2 |
| AD | 1.74E-05 | 1 | 1.74E-05 | 0.29 | 0.599 1 |
| BC | 0.000 7 | 1 | 0.000 7 | 11.28 | 0.007 3 |
| BD | 2.53E-05 | 1 | 2.53E-05 | 0.43 | 0.528 2 |
| CD | 0.000 4 | 1 | 0.000 4 | 6.18 | 0.032 2 |
| A2 | 0.000 1 | 1 | 0.000 1 | 2.36 | 0.155 7 |
| B2 | 1.16E-05 | 1 | 1.16E-05 | 0.20 | 0.667 9 |
| C2 | 0.001 6 | 1 | 0.001 6 | 26.53 | 0.000 4 |
| D2 | 1.23E-11 | 1 | 1.23E-11 | 2.07E-07 | 0.999 6 |
| 残差Residual | 0.000 6 | 10 | 5.91E-05 | — | — |
| 总和Cor total | 0.038 2 | 24 | — | — | — |
| 拟合统计指标Fit statistic index | 有效紫外辐照比例EURR | 辐照离散度ID |
|---|---|---|
| 标准差Standard deviation | 1.730 0 | 0.008 5 |
| 均值Mean | 25.930 0 | 0.313 6 |
| 变异系数Coefficient of variation/% | 6.680 0 | 2.710 0 |
| 决定系数R2 | 0.962 0 | 0.967 8 |
| 调整后决定系数Adjusted R2 | 0.952 0 | 0.954 5 |
| 预测拟合度Predicted R2 | 0.885 6 | 0.919 5 |
| 精度值Adequate precision | 37.878 5 | 31.003 3 |
表6 重新拟合后有效紫外辐照比例和辐照离散度的二次回归方程拟合统计指标
Table 6 Fitting statistics of the quadratic regression equation of effective ultraviolet radiation ratio and irradiance dispersion after refitting
| 拟合统计指标Fit statistic index | 有效紫外辐照比例EURR | 辐照离散度ID |
|---|---|---|
| 标准差Standard deviation | 1.730 0 | 0.008 5 |
| 均值Mean | 25.930 0 | 0.313 6 |
| 变异系数Coefficient of variation/% | 6.680 0 | 2.710 0 |
| 决定系数R2 | 0.962 0 | 0.967 8 |
| 调整后决定系数Adjusted R2 | 0.952 0 | 0.954 5 |
| 预测拟合度Predicted R2 | 0.885 6 | 0.919 5 |
| 精度值Adequate precision | 37.878 5 | 31.003 3 |
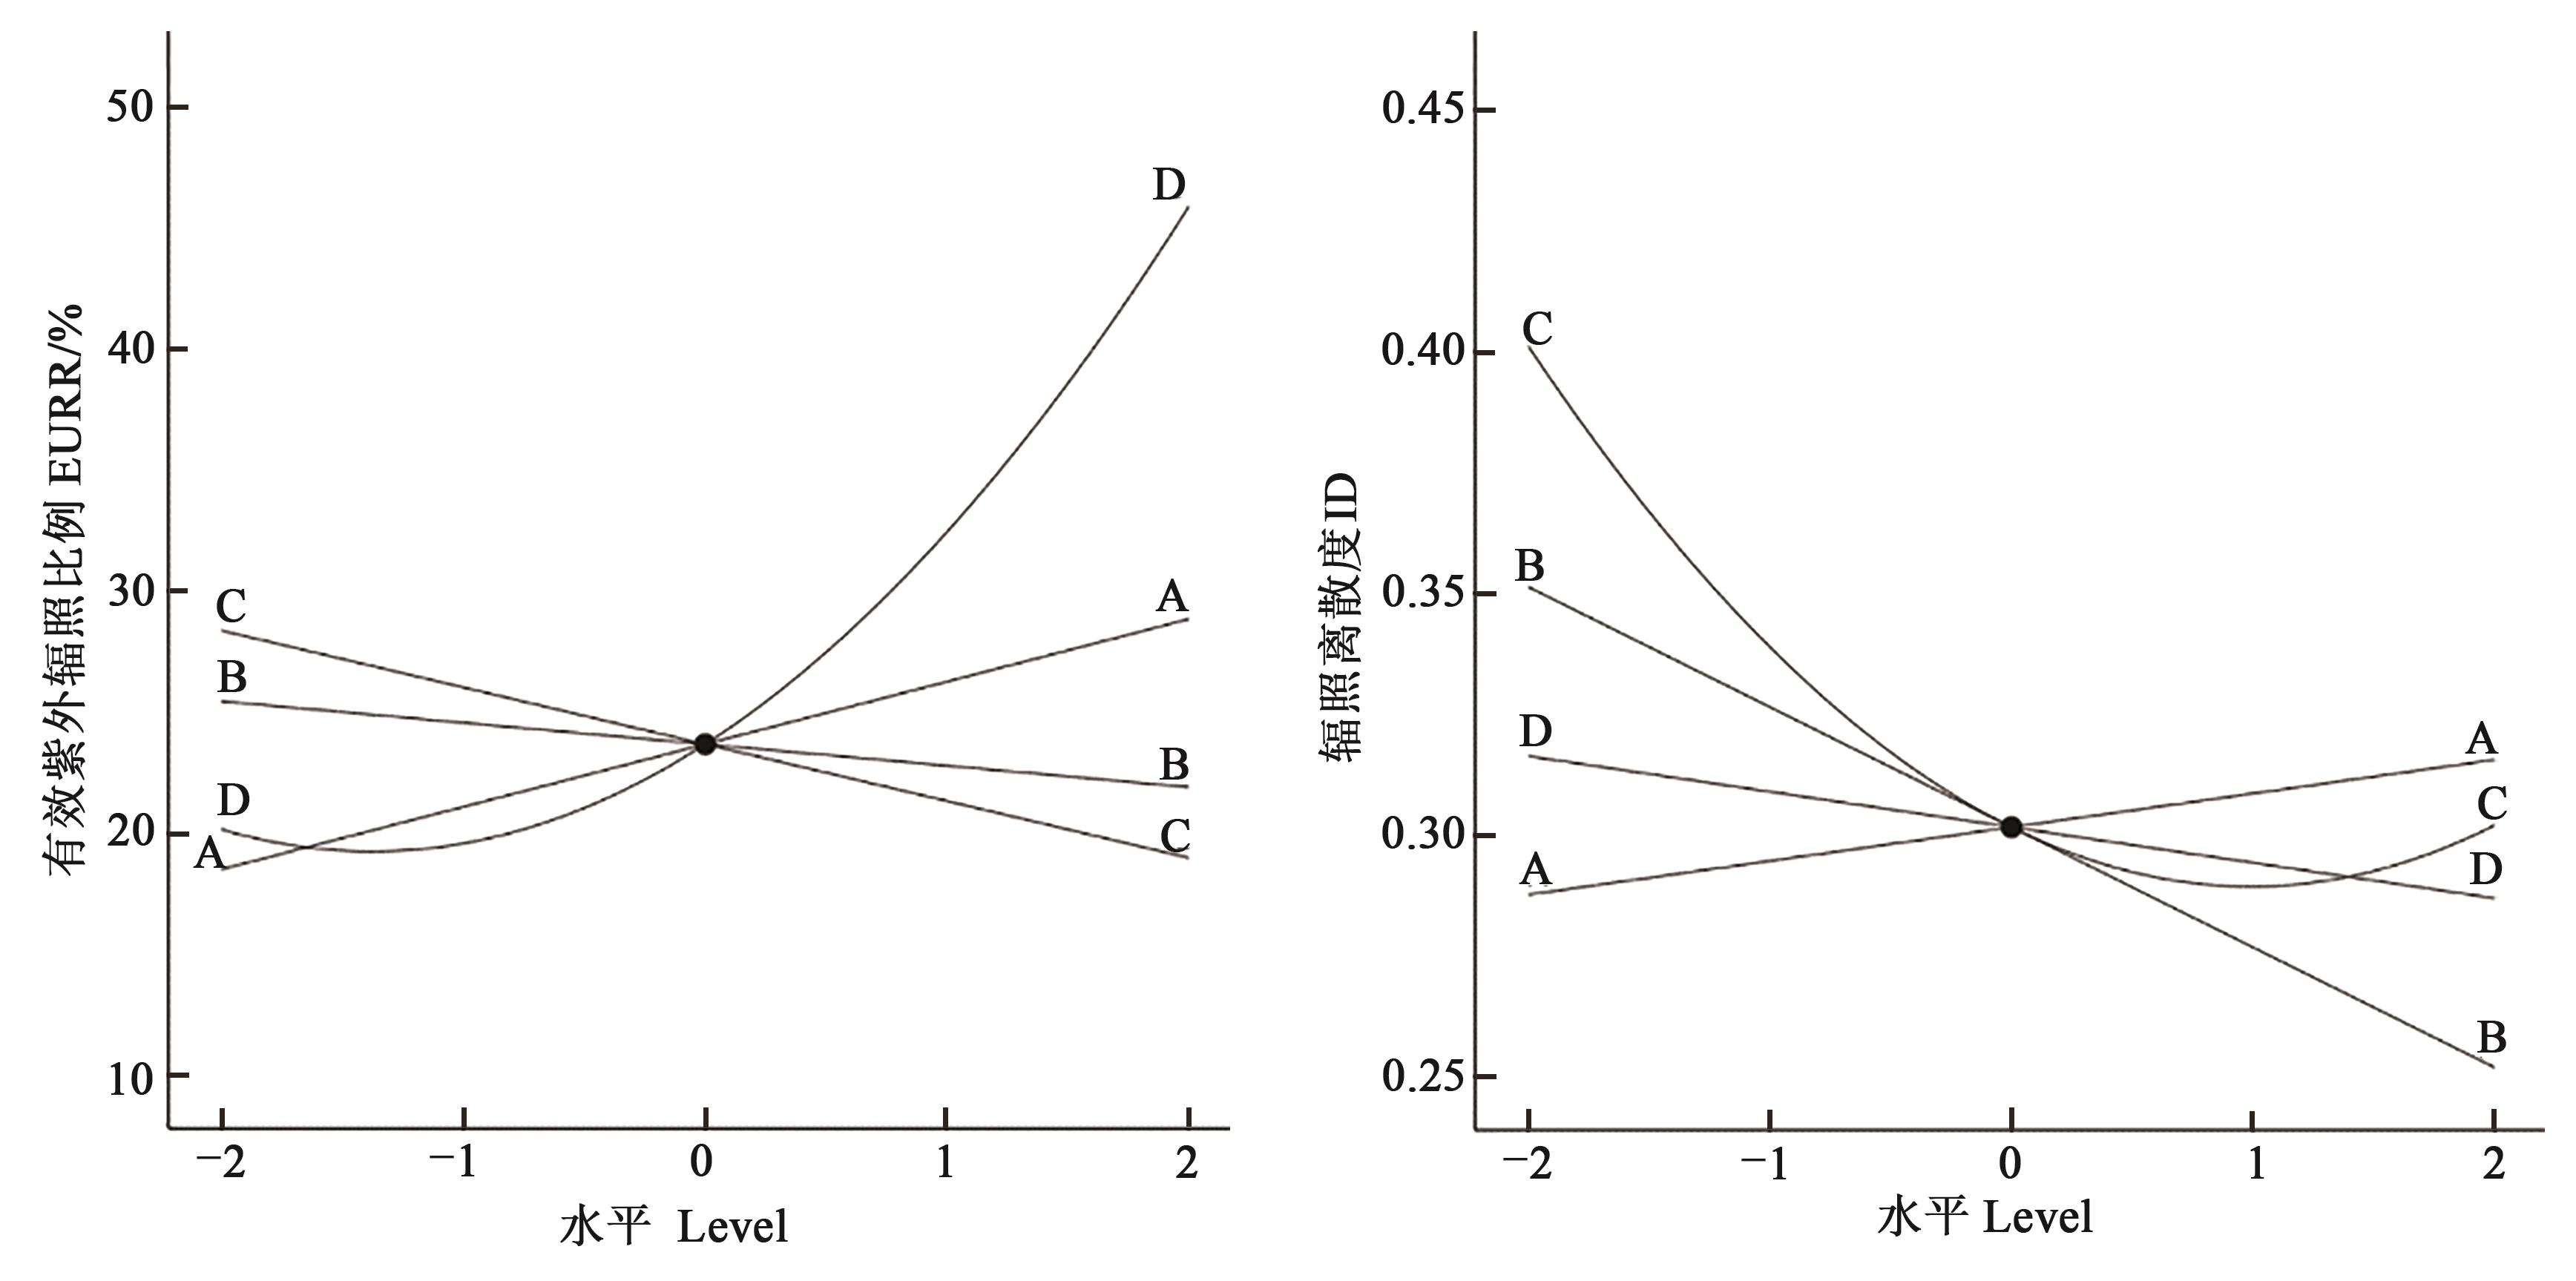
图11 有效紫外辐照比例和辐照离散度的单因素效应曲线注:A—管道内径;B—管壁厚度;C—管灯距离;D—双向反射分布函数。
Fig. 11 Effect of single factors on effective ultraviolet radiation ratio and irradiance dispersionNote:A—Inner diameter of tube;B—Thickness of tube wall;C—Tube-lamp distance;D—Bidirectional reflectance distribution function.
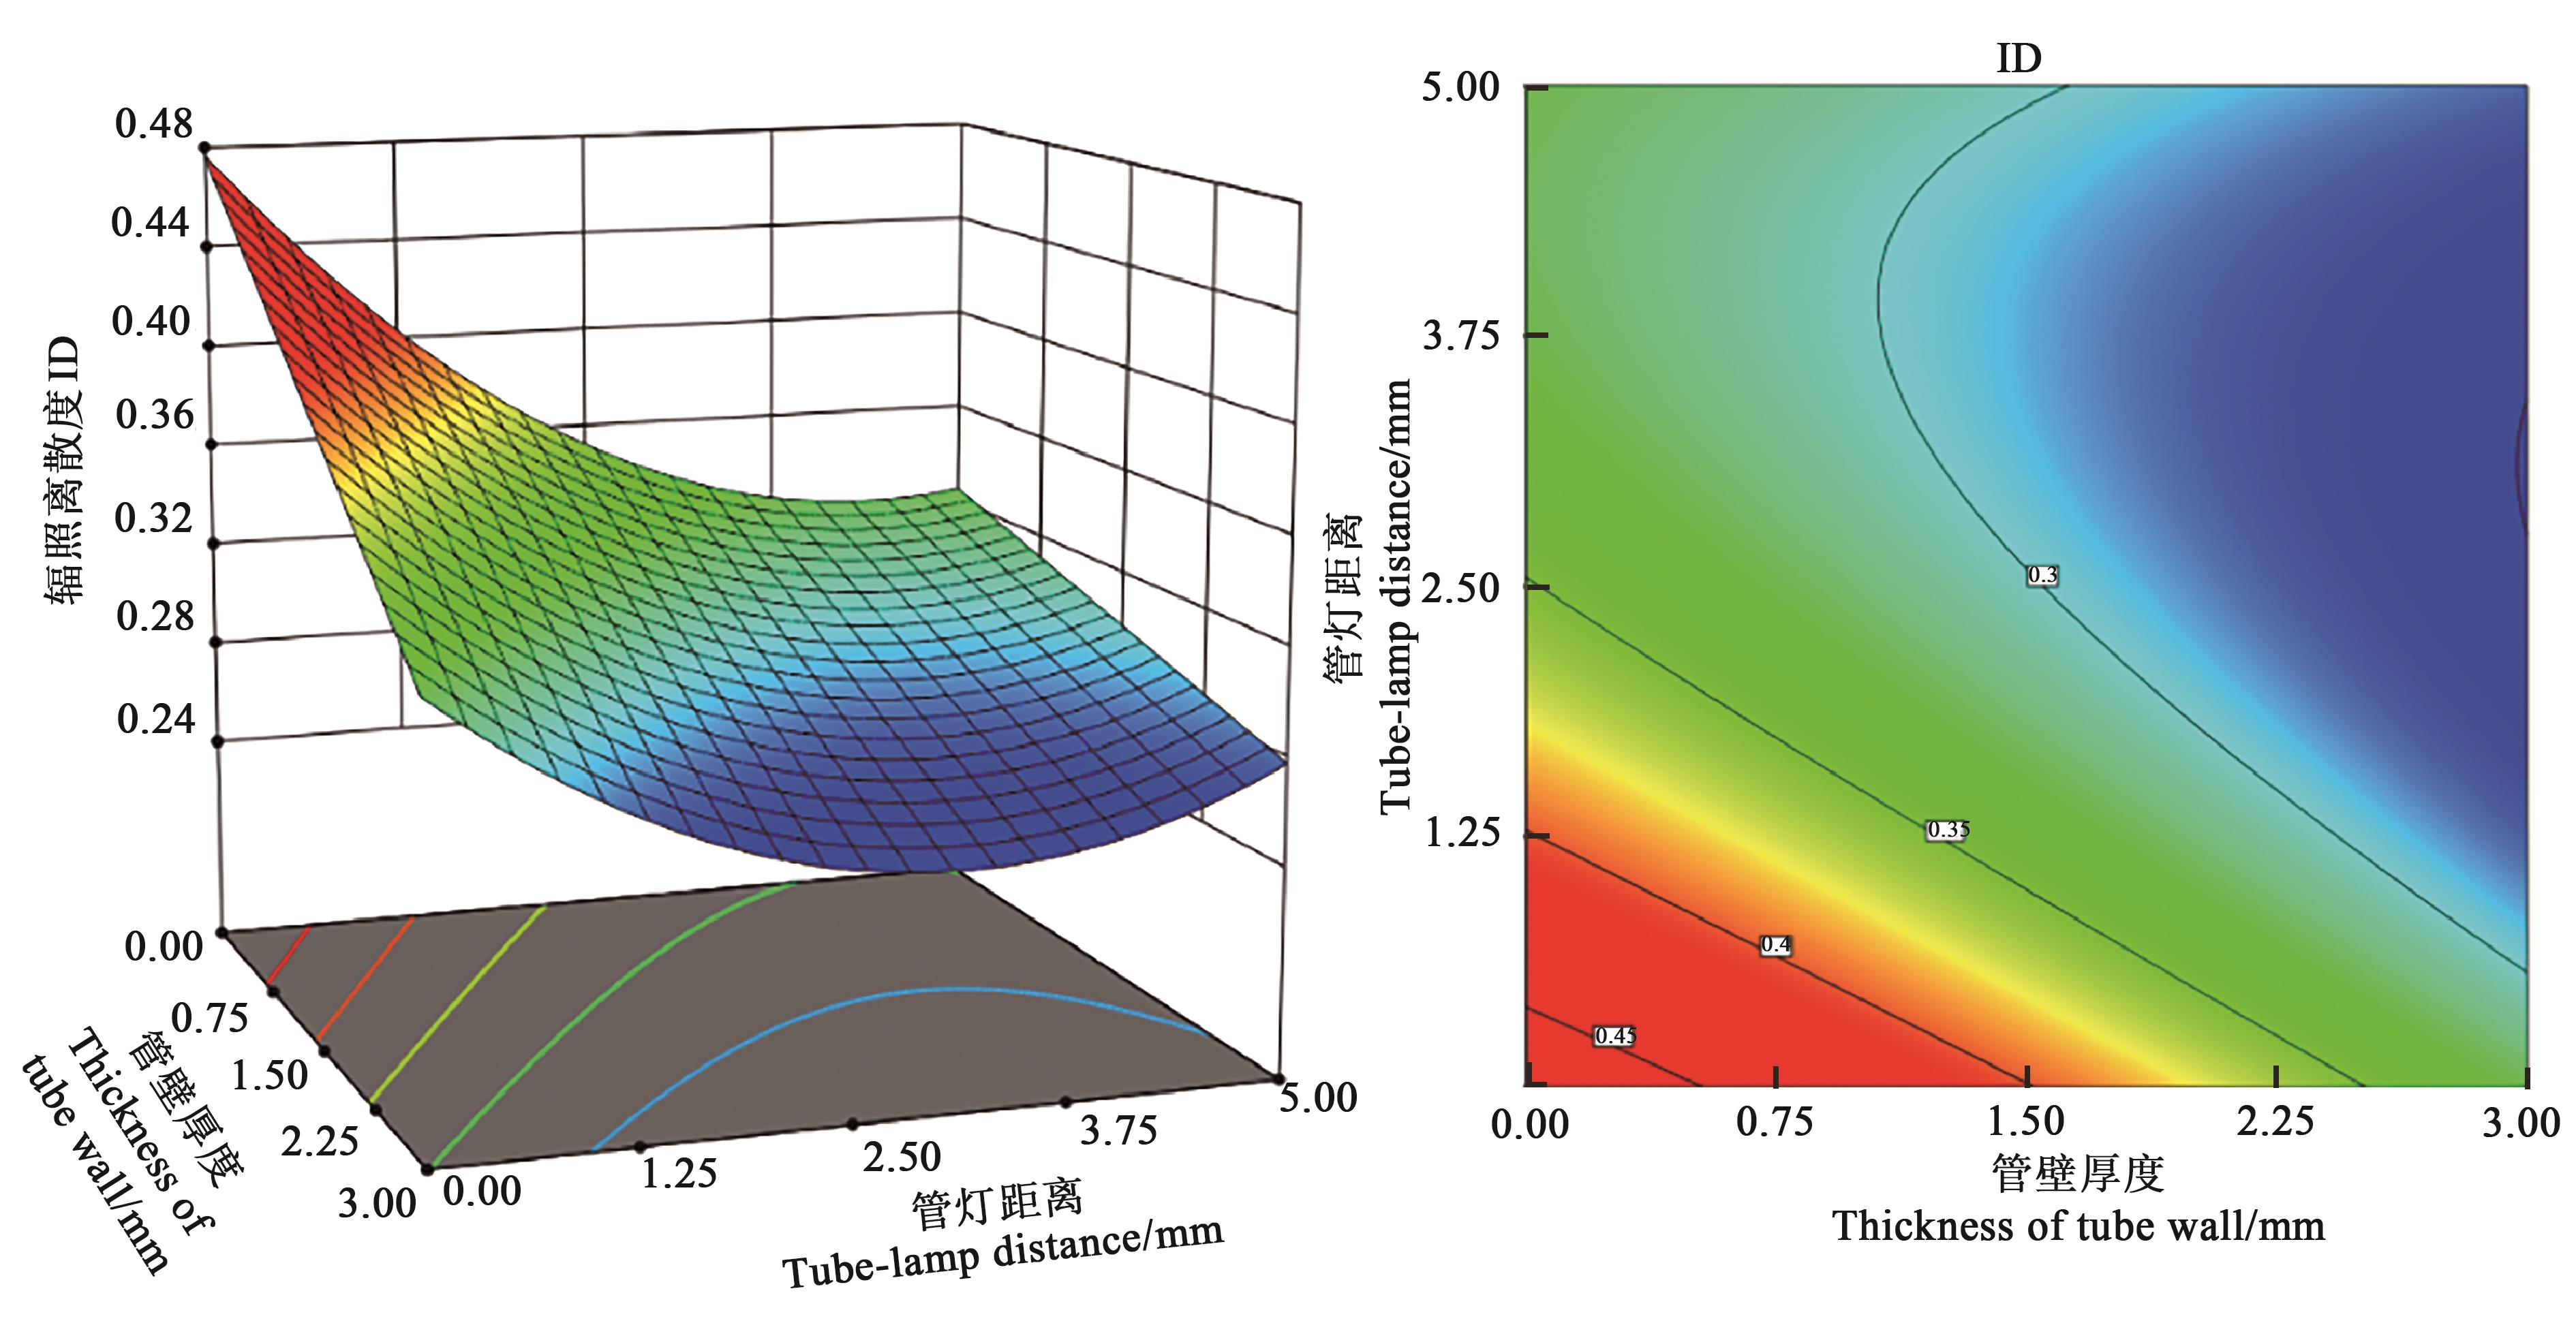
图12 管壁厚度与管灯距离的交互效应对辐照离散度的响应面图及等高线图
Fig. 12 Response surface for the interaction of tube wall thickness and tube-lamp distance on irradiance dispersion
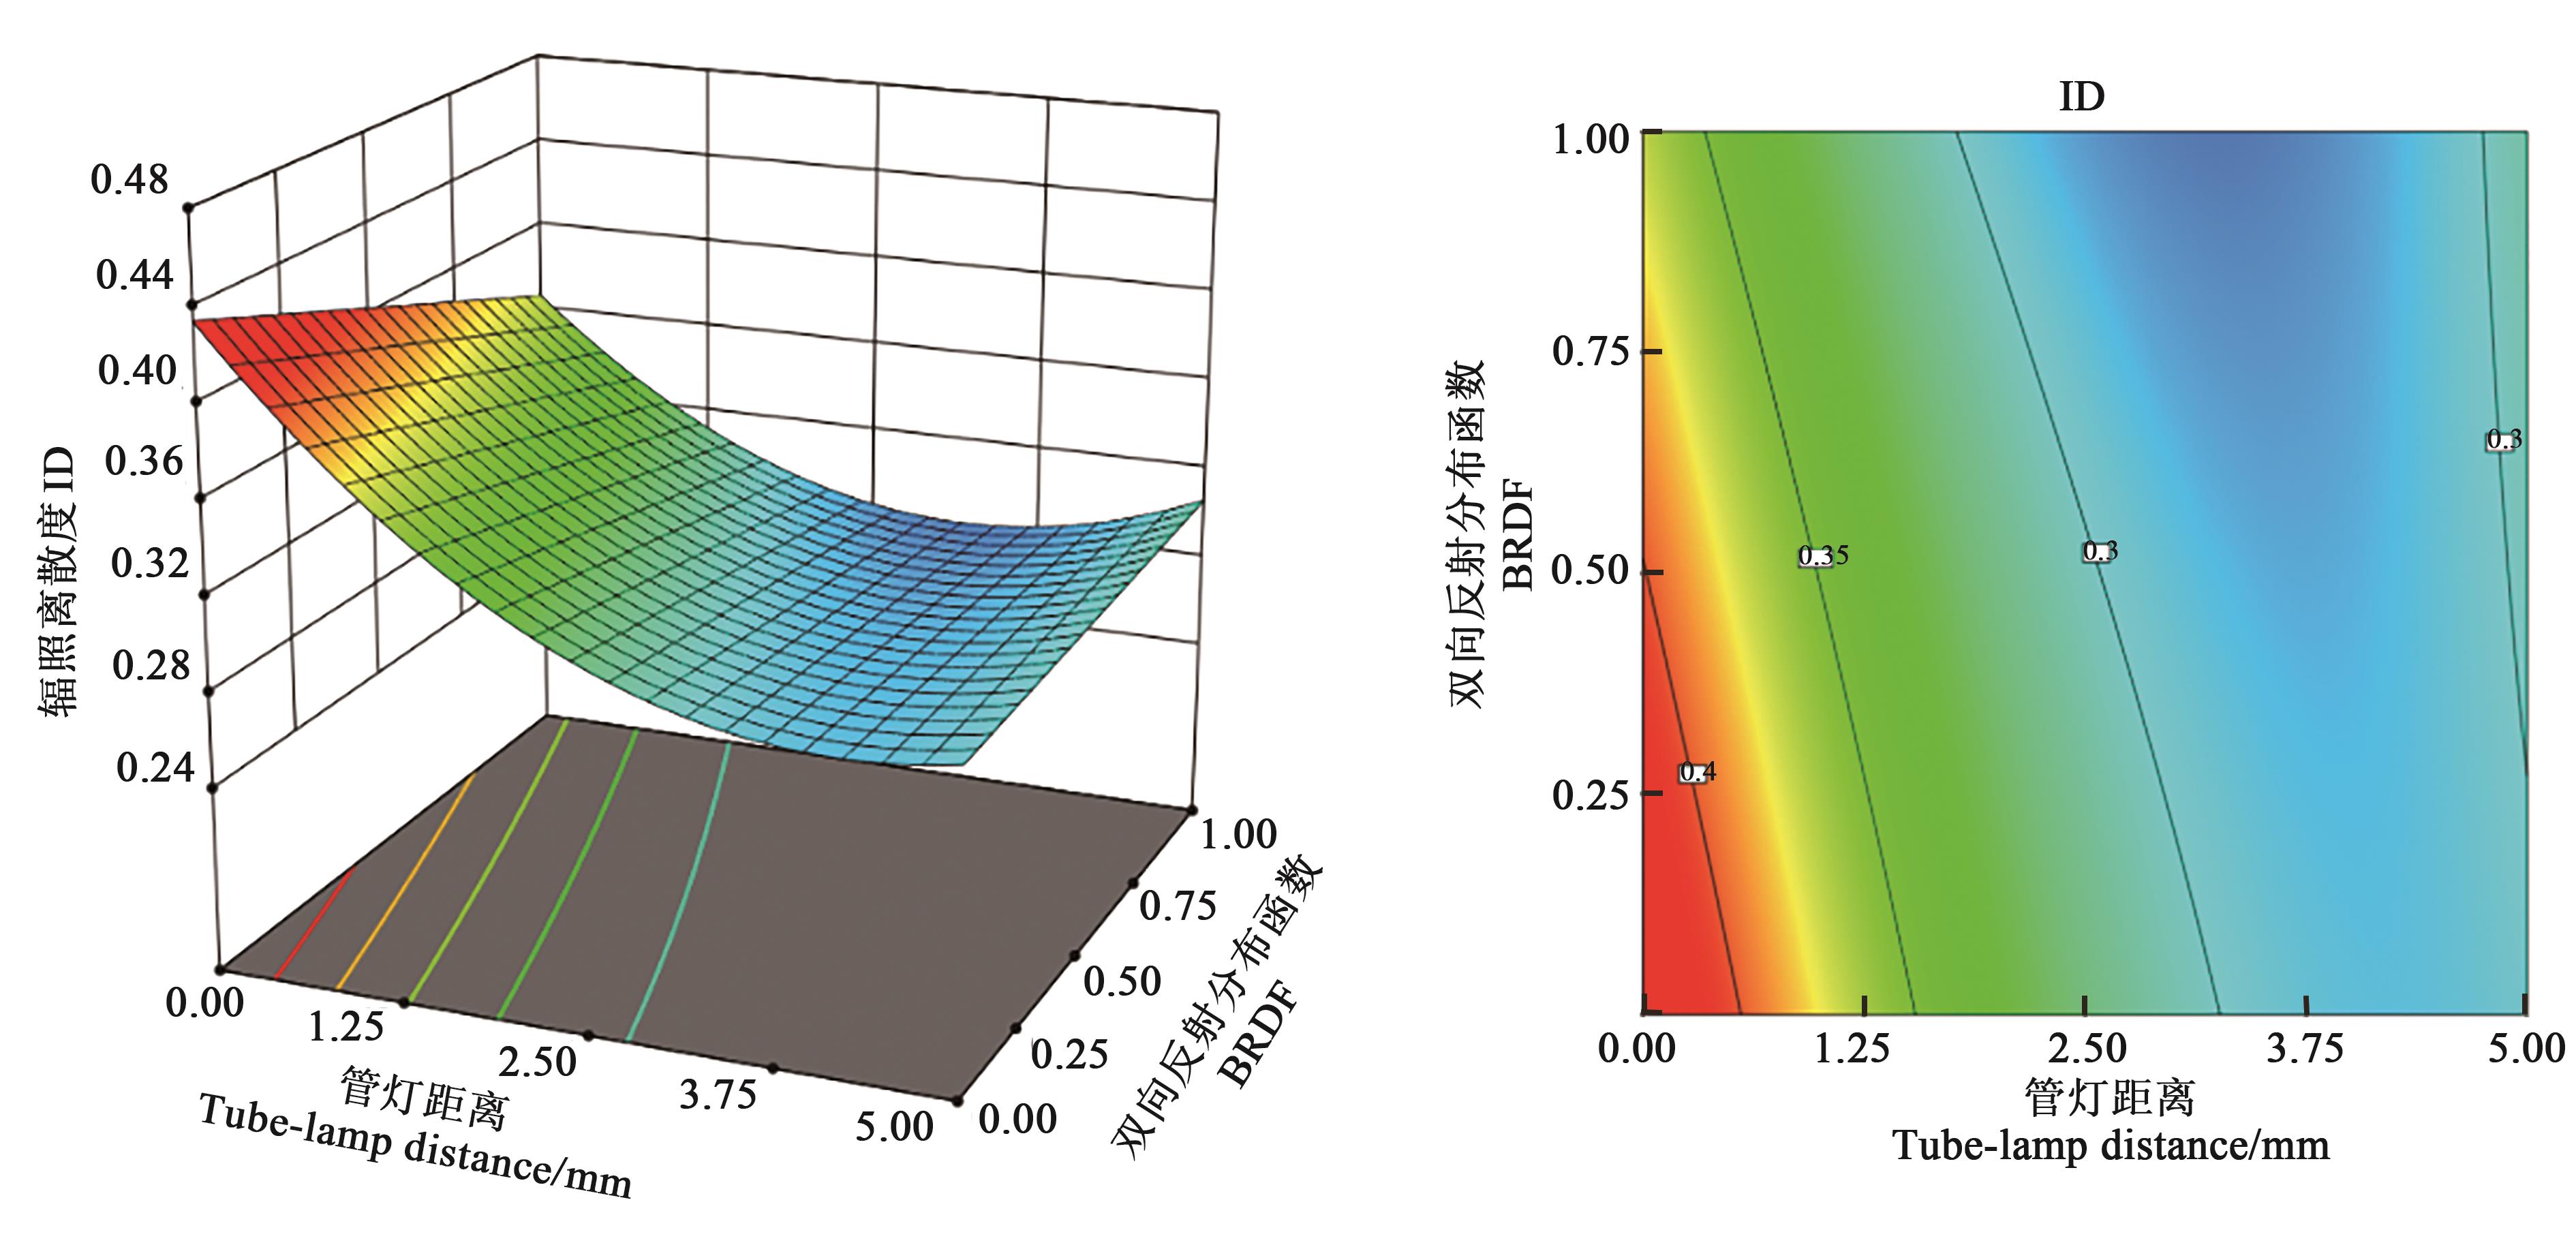
图13 管灯距离与BRDF的交互效应对辐照离散度的响应面图及等高线图
Fig. 13 Response surface for the interaction of tube-lamp distance and BRDF on irradiance dispersion
序号 Number | 管道内径 Inner diameter of tube/mm | 管壁厚度Thickness of tube wall/mm | 管灯距离Tube-lamp distance/mm | 双向反射分布函数 BRDF | 有效紫外辐照比例 EURR/% | 辐照离散度ID | 复合合意度 Composite desirability |
|---|---|---|---|---|---|---|---|
| 1 | 50.00 | 3.000 | 0.556 | 1 | 52.955 9 | 0.284 957 | 0.058 412 8 |
| 2 | 50.00 | 3.000 | 0.009 | 1 | 53.982 4 | 0.305 335 | 0.057 210 2 |
| 3 | 49.42 | 2.268 | 0.000 | 1 | 54.633 0 | 0.341 957 | 0.046 972 4 |
| 4 | 50.00 | 2.951 | 3.828 | 1 | 46.865 1 | 0.263 957 | 0.038 111 3 |
| 5 | 50.00 | 0.043 | 3.988 | 1 | 50.003 4 | 0.333 833 | 0.035 034 1 |
| 6 | 39.83 | 3.000 | 2.557 | 1 | 45.147 4 | 0.240 142 | 0.035 022 2 |
| 7 | 24.09 | 3.000 | 0.000 | 1 | 43.690 6 | 0.277 902 | 0.026 365 7 |
| 8 | 27.54 | 0.000 | 4.026 | 1 | 41.046 3 | 0.310 753 | 0.016 768 1 |
| 9 | 27.95 | 2.882 | 3.944 | 1 | 37.956 7 | 0.244 203 | 0.014 896 7 |
表7 优化后的参数组合及响应面法预测结果
Table 7 Optimized parameter combinations and prediction results of response surface method
序号 Number | 管道内径 Inner diameter of tube/mm | 管壁厚度Thickness of tube wall/mm | 管灯距离Tube-lamp distance/mm | 双向反射分布函数 BRDF | 有效紫外辐照比例 EURR/% | 辐照离散度ID | 复合合意度 Composite desirability |
|---|---|---|---|---|---|---|---|
| 1 | 50.00 | 3.000 | 0.556 | 1 | 52.955 9 | 0.284 957 | 0.058 412 8 |
| 2 | 50.00 | 3.000 | 0.009 | 1 | 53.982 4 | 0.305 335 | 0.057 210 2 |
| 3 | 49.42 | 2.268 | 0.000 | 1 | 54.633 0 | 0.341 957 | 0.046 972 4 |
| 4 | 50.00 | 2.951 | 3.828 | 1 | 46.865 1 | 0.263 957 | 0.038 111 3 |
| 5 | 50.00 | 0.043 | 3.988 | 1 | 50.003 4 | 0.333 833 | 0.035 034 1 |
| 6 | 39.83 | 3.000 | 2.557 | 1 | 45.147 4 | 0.240 142 | 0.035 022 2 |
| 7 | 24.09 | 3.000 | 0.000 | 1 | 43.690 6 | 0.277 902 | 0.026 365 7 |
| 8 | 27.54 | 0.000 | 4.026 | 1 | 41.046 3 | 0.310 753 | 0.016 768 1 |
| 9 | 27.95 | 2.882 | 3.944 | 1 | 37.956 7 | 0.244 203 | 0.014 896 7 |
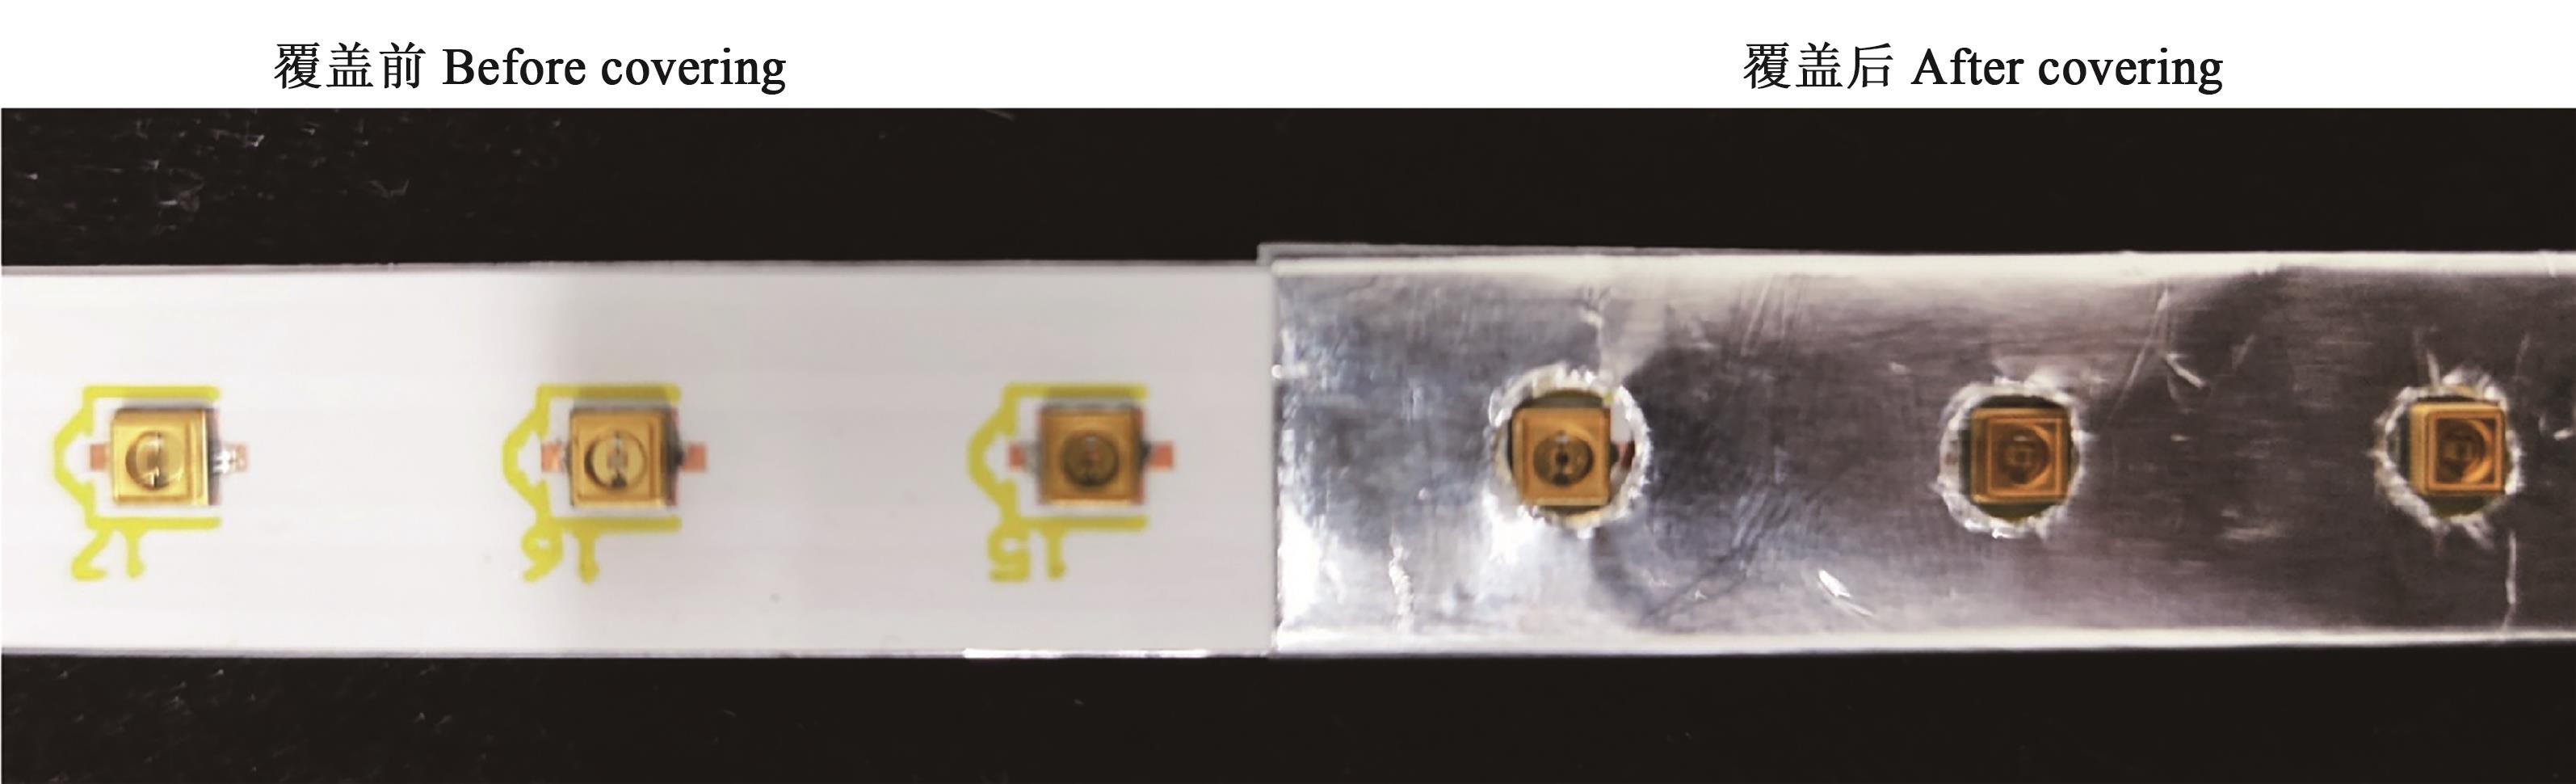
图14 UV-LED灯条内表面铝箔覆盖前后对比
Fig. 14 Comparison of the inner surface of UV-LED bar before and after covered by aluminum foil
| 1 | 杨其长.植物工厂系统与实践[M].北京:化学工业出版社,2012:2-3. |
| 2 | 刘家源,张玉彬,刘文科.采前红蓝光连续光照光强对水培生菜生长、品质及AsA代谢的影响[J].中国农业科技导报,2022,24(5):76-84. |
| LIU J Y, ZHANG Y B, LIU W K. Effects of pre-harvest red and blue continuous light intensity on growth, quality and AsA metabolism of hydroponics lettuce [J]. J. Agric. Sci. Technol., 2022, 24(5):76-84. | |
| 3 | 张玉彬,刘文科,杨其长,等.采前不同比例LED红蓝光连续光照对生菜光合特性及产量和品质的影响[J].中国农业科技导报,2021,23(10):66-73. |
| ZHANG Y B, LIU W K, YANG Q C, et al.. Effects of different ratios of LED red and blue continuous light on the photosynthetic characteristics, yield and quality of lettuce before harvest [J]. J. Agric. Sci. Technol., 2021, 23(10):66-73. | |
| 4 | ZHANG W L, LIU W K, YANG Q C. Reducing nitrate content in lettuce by pre-harvest continuous light delivered by red and blue light-emitting diodes [J]. J. Plant Nutr., 2013, 36(3):481-490. |
| 5 | BIAN Z H, CHENG R F, WANG Y, et al.. Effect of green light on nitrate reduction and edible quality of hydroponically grown lettuce (Lactuca sativa L.) under short-term continuous light from red and blue light-emitting diodes [J]. Environ. Exp. Bot., 2018, 153:63-71. |
| 6 | LEI B, BIAN Z H, YANG Q C, et al.. The positive function of selenium supplementation on reducing nitrate accumulation in hydroponic lettuce (Lactuca sativa L.) [J]. J. Integr. Agric., 2018, 17(4):837-846. |
| 7 | 刘文科,杨其长.现代设施园艺的最高形式——植物工厂[J].科技导报,2013,31(33):1. |
| 8 | STRAYER R F. Dynamics of microorganism populations in recirculating nutrient solutions [J]. Adv. Space Res., 1994, 14(11):357-366. |
| 9 | HONG C X, MOORMAN G W. Plant pathogens in irrigation water: challenges and opportunities [J]. Crit. Rev. Plant Sci., 2005, 24(3):189-208. |
| 10 | 李倩.番茄潮汐式育苗营养液细菌和真菌群落结构动态分析[D].北京:中国农业科学院,2019. |
| LI Q. Analysis of bacterial and fungal community structure in the recirculating nutrient solution of tomato plug seedlings under ebb-and-flow irrigation [D]. Beijing: Chinese Academy of Agricultural Sciences, 2019. | |
| 11 | ATMATJIDOU V P, FYNN R P, HOITINK H A J. Dissemination and transmission of Xanthomonas campestris pv. begoniae in an ebb and flow irrigation system [J]. Plant Dis., 1991, 75(12):1261-1265. |
| 12 | GRIESBACH E, LATTAUSCHKE E. Übertragung von Clavibacter michiganensis subsp. michiganensis in Tomaten-Hydroponikkulturen und Möglichkeiten zur Bekämpfung des Erregers [J]. Nachrichtenbl. Dtsch. Pflanzenschutzdienstes (Braunschweig, Ger.), 1991, 43(4):69-73. |
| 13 | KŮDELA V, KREJZAR V, PÁNKOVÁ I. Pseudomonas corrugata and Pseudomonas marginalis associated with the collapse of tomato plants in rockwool slab hydroponic culture [J]. Plant Prot. Sci., 2011, 46(1):1-11. |
| 14 | FUJIWARA K, AOYAMA C, TAKANO M, et al.. Suppression of Ralstonia solanacearum bacterial wilt disease by an organic hydroponic system [J]. J. Gen. Plant Pathol., 2012, 78(3):217-220. |
| 15 | ACHER A, HEUER B, RUBINSKAYA E, et al.. Use of ultraviolet-disinfected nutrient solutions in greenhouses [J]. J. Hortic. Sci., 1997, 72(1):117-123. |
| 16 | ZHANG W, TU J C. Effect of ultraviolet disinfection of hydroponic solutions on Pythium root rot and non-target bacteria [J]. Eur. J. Plant Pathol., 2000, 106(5):415-421. |
| 17 | 宋卫堂,王成,侯文龙.紫外线-臭氧组合式营养液消毒机的设计及灭菌性能试验[J].农业工程学报,2011,27(2):360-365. |
| SONG W T, WANG C, HOU W L. Development and test of nutrient solution disinfection machine by combining UV with ozone [J]. Trans. Chin. Soc. Agric. Eng., 2011, 27(2):360-365. | |
| 18 | 王伟琳,何芬,丁小明,等.营养液循环灌溉紫外线消毒机设计研究[J].农机化研究,2018,40(9):69-73, 80. |
| WANG W L, HE F, DING X M, et al.. Design of ultraviolet disinfection machine for circulating irrigation of nutrient solution [J]. J. Agric. Mech. Res., 2018, 40(9):69-73, 80. | |
| 19 | 李东星,田真,王浚峰,等.植物工厂营养液循环再利用装备的研究应用[J].农业工程,2011,1(1):46-51. |
| LI D X, TIAN Z, WANG J F, et al.. Research and application on a nutrient recycle equipment [J]. Agric. Eng., 2011, 1(1):46-51. | |
| 20 | WANG X, FANG W, ZHAO Z. Design of UVA ultraviolet disinfection system for nutrient solution residual liquid and development of microbial online monitoring system [J]. Sustainability, 2023, 15(1):173-182. |
| 21 | TSUNEDOMI A, MIYAWAKI K, MASAMURA A, et al.. UVA‐LED device to disinfect hydroponic nutrient solution [J]. Tokushima J. Exp. Med., 2018, 65(3.4):171-176. |
| 22 | 杜朋伟.高效紫外发光二极管的理论与实验研究[D].杭州:浙江大学,2022. |
| DU P W. Theoretical and experimental research on high efficiency ultraviolet light emitting diodes [D]. Hangzhou: Zhejiang University, 2022. | |
| 23 | 王勇.AlGaN深紫外LED外量子效率提升方法研究[D].长春:中国科学院大学,2022. |
| WANG Y. Research on improving external quantum efficiency of AlGaN-based deep ultraviolet light emitting diodes [D]. Changchun: University of Chinese Academy of Sciences, 2022. | |
| 24 | 李晋闽,闫建昌,郭亚楠,等.紫外LED研究进展[J].科技导报,2021,39(14):30-41. |
| LI J M, YAN J C, GUO Y N, et al.. Recent progress of ultraviolet light-emitting diodes [J]. Sci. Technol. Rev., 2021, 39(14):30-41. | |
| 25 | KIM B S, YOUM S, KIM Y K. Sterilization of harmful microorganisms in hydroponic cultivation using an ultraviolet LED light source [J]. Sens. Mater., 2020, 32(11):3773-3785. |
| 26 | HESSLING M, GROSS A, HOENES K, et al.. Efficient disinfection of tap and surface water with single high power 285 nm LED and square quartz tube [C]//Photonics. Multidisciplinary Digital Publishing Institute, 2016, 3(1):7. |
| 27 | JENNY R M, JASPER M N, SIMMONS III O D, et al.. Heuristic optimization of a continuous flow point-of-use UV-LED disinfection reactor using computational fluid dynamics [J]. Water Res., 2015, 83(10):310-318. |
| 28 | OGUMA K, KITA R, TAKIZAWA S. Effects of arrangement of UV light-emitting diodes on the inactivation efficiency of microorganisms in water [J]. Photochem. Photobiol., 2016, 92(2):314-317. |
| 29 | 吴燕涛.鲜榨苹果汁管式液膜紫外杀菌的CFD模拟[D].海口:华南热带农业大学,2005. |
| WU Y T. Computation fluid dynamics modeling the UV-sterilization of fresh apple juice in fluid film [D]. Haikou: South China University of Tropical Agriculture, 2005. | |
| 30 | 中华人民共和国国家质量监督检验检疫总局,中国国家标准化管理委员会. 一般工业用铝及铝合金板、带材: [S].北京:中国标准出版社,2006. |
| 31 | 李聪,王咏梅,张仲谋.紫外光谱辐射定标中的漫反射板反射特性研究[J].光谱学与光谱分析,2008,28(4):865-869. |
| LI C, WANG Y M, ZHANG Z M. The study of aluminium diffuser calibration in the UV [J]. Spectrosc. Spect. Anal., 2008, 28(4):865-869. | |
| 32 | 李炳强,曹佃生,林冠宇,等.真空远紫外波段铝基漫反射板BRDF特性研究[J].激光与红外,2020,50(9):1138-1144. |
| LI B Q, CAO D S, LIN G Y, et al.. BRDF characteristics research on aluminum-based diffuser in vacuum and far ultraviolet waveband [J]. Laser Infrared, 2020, 50(9):1138-1144. |
| [1] | 王彦芳, 赵瑞雪. “数据 + AI”双向赋能机制与农业领域实践[J]. 中国农业科技导报, 2025, 27(9): 11-20. |
| [2] | 崔凤, 刘荆州, 钱易鑫, 陈桂莹. 中国海洋渔业生态安全时空演变与驱动因素分析[J]. 中国农业科技导报, 2025, 27(9): 224-239. |
| [3] | 许海涛, 马红珍, 王文文, 范文祥, 许波, 张军刚, 郭海斌, 王友华. 基于有效积温的玉米株高与茎粗动态发育及其积温模型研究[J]. 中国农业科技导报, 2025, 27(8): 187-201. |
| [4] | 吴正, 杨红云, 孙爱珍, 孔杰, 黄淑梅. 基于CA_MobileViT模型的水稻钾素营养诊断研究[J]. 中国农业科技导报, 2025, 27(8): 80-88. |
| [5] | 史敏, 徐珍艳, 罗建. 基于学科交叉的未来产业识别研究[J]. 中国农业科技导报, 2025, 27(7): 10-19. |
| [6] | 豆中中, 刘一琦. 弧爪式马铃薯精量排种器的仿真分析[J]. 中国农业科技导报, 2025, 27(4): 110-119. |
| [7] | 吴建伟, 张琳, 郑文刚, 秦向阳, 吴忠高, 方锡红, 王永泉, 芦天罡, 王健, 朴香淑, 王芳, 岳巧云, 张海合, 季婧, 丛小蔓, 李奇峰. 智慧果园关键应用场景研究进展[J]. 中国农业科技导报, 2025, 27(3): 12-23. |
| [8] | 史丹一, 邱禹, 黄成真, 王娟. 酸改性生物炭对滨海盐渍土壤水分入渗特性的影响[J]. 中国农业科技导报, 2024, 26(9): 183-192. |
| [9] | 傅丽君, 林潇雨, 林建华, 沈慧男, 吴勇镇. 红松茸牛肉酱加工工艺及货架期研究[J]. 中国农业科技导报, 2024, 26(6): 148-158. |
| [10] | 黄跃, 谢晏芬, 朱宣全, 贾孟, 王戈, 白羽祥, 杜宇, 周鹏, 赵宇婷, 朱红琼, 杨帆, 肖志文, 王文波, 方志鹏, 韩家宝, 王娜. 植烟区烟叶氯含量风险评估及影响因素分析[J]. 中国农业科技导报, 2024, 26(6): 206-213. |
| [11] | 陈小双, 徐兴倩, 赵熹, 屈新, 王海军, 彭光灿. 镉污染红黏土电阻率特性及其评价模型研究[J]. 中国农业科技导报, 2024, 26(4): 164-173. |
| [12] | 潘越, 王宝庆, 王季姣, 马勇, 李亚兰. 不同山葡萄品种CO2响应模型拟合及评价[J]. 中国农业科技导报, 2024, 26(4): 58-66. |
| [13] | 王薇, 付虹雨, 卢建宁, 岳云开, 杨瑞芳, 崔国贤, 佘玮. 基于无人机航拍的苎麻倒伏信息解译研究[J]. 中国农业科技导报, 2024, 26(3): 91-97. |
| [14] | 丛文成, 袁立敏, 蒙仲举, 杨宇. 玉米芯颗粒对风沙土毛管水运移和蒸发特性的影响[J]. 中国农业科技导报, 2024, 26(2): 198-207. |
| [15] | 杨皓森. 中国大豆生物育种产业化对贸易依存度的影响[J]. 中国农业科技导报, 2024, 26(11): 15-22. |
| 阅读次数 | ||||||
|
全文 |
|
|||||
|
摘要 |
|
|||||